Origin 2017 Features
Origin 2017 Highlights
The table below only lists some highlights of Origin 2017. To see more features in 2017, please use the navigation bar on the left panel of this page.
Please download 2017_Graphing.opj and 2017_Others.opj to try some new features.
Please download 2017 LaTeX to use it in Origin 2017.
Origin Interface
JIRA | SUMMARY | DETAILS |
|---|---|---|
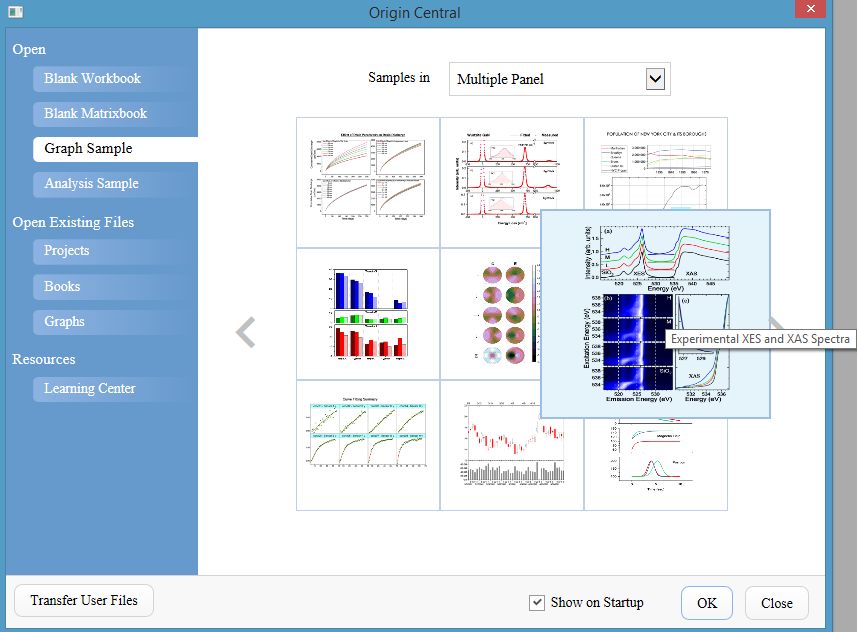
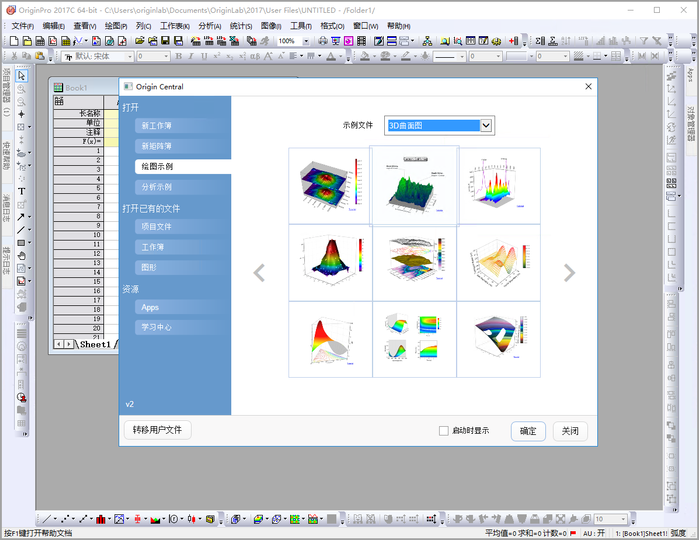
| Origin Central dialog | Origin Central dialog opens unpon launching Origin 2017 (F11)
Choose Help : Origin Central from the main menu or Press F11 to open the dialog.
| |
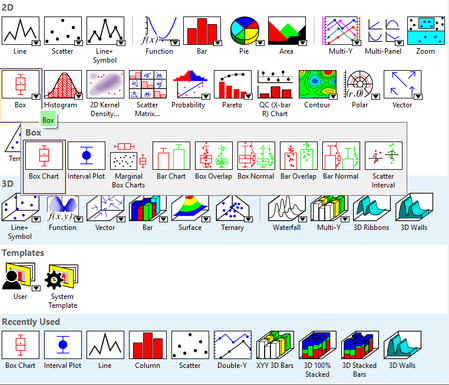
| ORG-14889 | Plot menu shows plot type with larger icons. More built-in plot types. E.g. box plot has many variatiions with can be plotted with one click from Plot menu. |
Note: If you prefer the old menu, go to Origin exe folder. Rename PlotPopup folder. Restart Origin. The Plot menu will go back to the old way. |
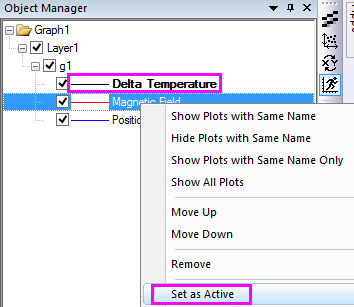
Object Manager Improvements:
|
| |
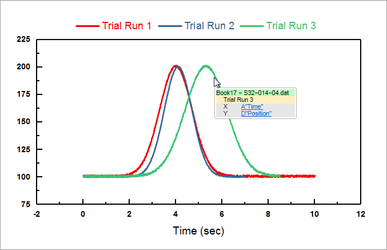
| ORG-15060 | Mouse hover data plot to show plot tooltip | In the Graph window, mousing over the data plots to see the data information of each plot
System Variable : @PT to enable plot tooltip, 0 – disable plot tooltip 1 – enable 2d plot tooltip only 2 – enable 3d plot tooltip only 3 – enable both 2d and 3d plot |
| ORG-14989 | Help: Open Folders to easily navigate to the folder in Windows Explorer |
|
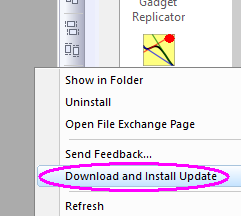
| ORG-15241 | Distribute more Origin samples via Check for Updates | New Origin samples can be downloaded and auto installed via Help : Check for Updates as an opx file. |
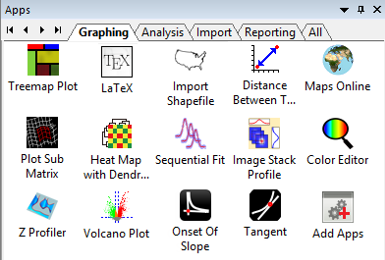
| ORG-14657 | Add tabs to Apps bar | Tabs are added on the top of Apps bar for easier navigating to apps. Users are able to create, remove or rename a tab.
|
| Support Chinese GUI (SR1) | Origin start to support Chinese GUI from 2017 SR1.
| |
| Show Object Manager by default (SR1) | Many user may not know we have a tool to easily manipulate plots, layers in graph. It's docked on top of Apps Gallery on the right side of Origin workspace. | |
| Graph: Add Function Graph... is renamed as Add Function Plot... (SR1) | So user understands this is to add function plot in current graph window. | |
| Plot: Double Y: Double Y Column menu added (SR1) | User can directly select two Y columns and plot as Double Y column plots. | |
Help: Programming submenus are brought back (SR1)
| We hide them in Origin 2017 SR0 but user felt it's hard to find only LabTalk Helps, etc. So we bring the submenus back. | |
| Help: Live Support Chat... menu is added (SR1) | User can choose to get help from Tech support online | |
Help: Contact Support... menu is updated (SR1) | User will bring to our webpage with many info. prefilled to submit the contact support form easier. | |
More Import data types are added to File: Importcollapsible menu by default (SR1) | CSV, Matlab, OPJ, Image to Matrix show by default under File: Import menu. | |
| App Gallery Improvements.(SR1) |
| |
| Improvements on Origin Central (SR1) |
| |
| Show Preview to the right of Image Analysis dialogs (SR1) | Before Origin 2017 SR1, the image preview for many XFs related to image processing is at the bottom of the dialog. This makes it awkward to use:
|
Graphing
New Graph Types
JIRA | SUMMARY | DETAILS |
|---|---|---|
| Box Plot Improvements |
| |
| Line Series Plot Improvements | The Line Series plot has been redone in Origin 2017 and is based on box plot. No hidden sheet is created. Changing raw data will update the graph. It has more customization options, such as
| |
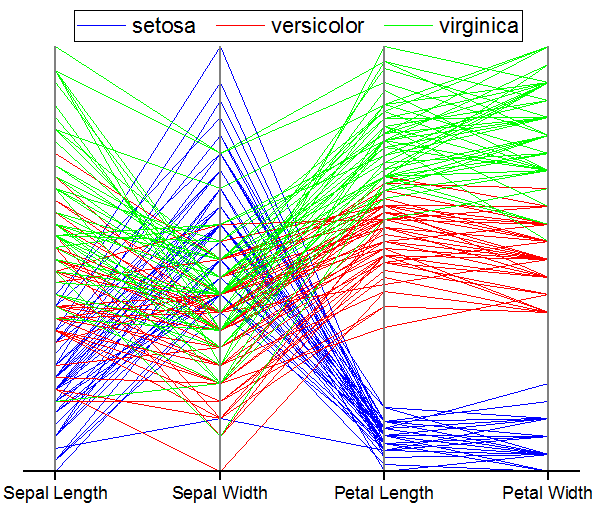
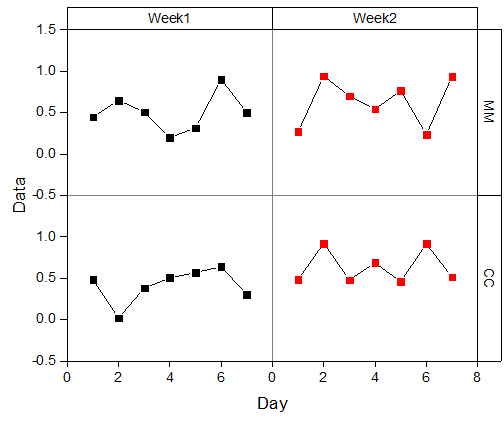
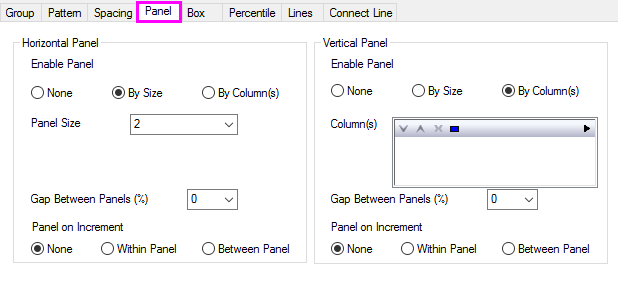
| ORG-8205 | Trellis Plot |
|
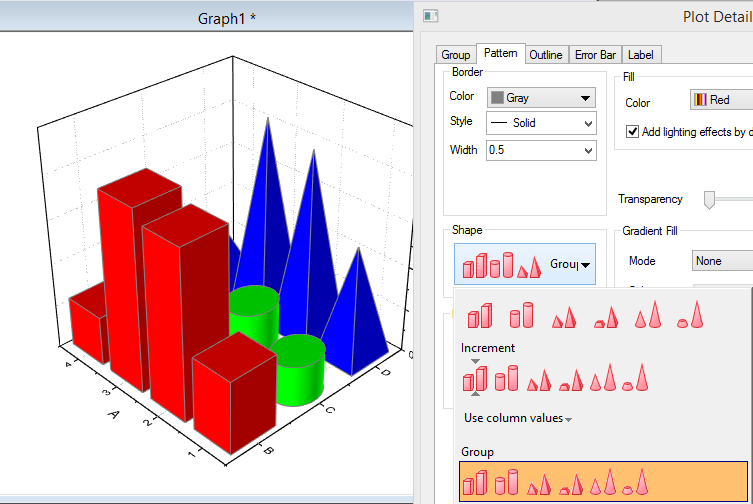
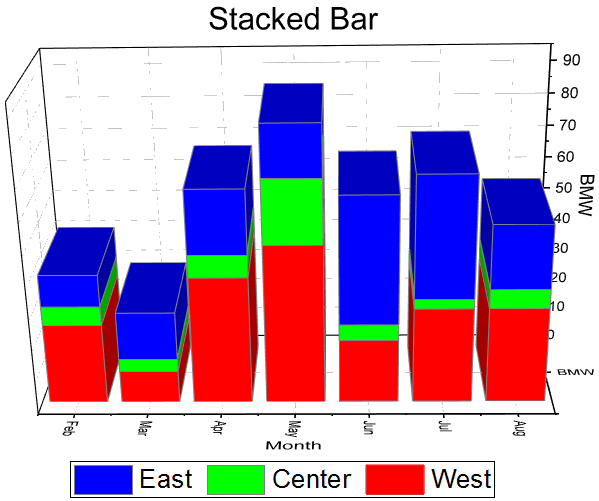
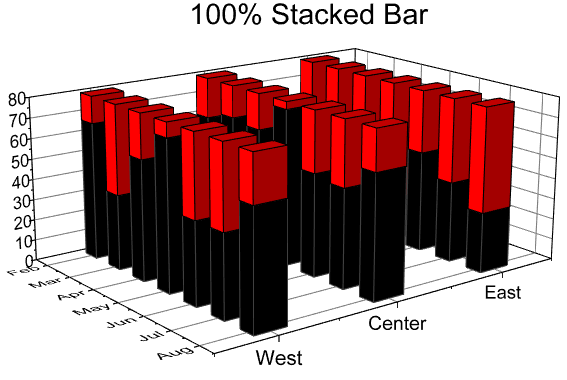
| 3D Bars, Stacked Bars, 100% Percent Stacked Bars |
|
Labels, Legend, Color Scale and Bubble Scale
JIRA | SUMMARY | DETAILS |
|---|---|---|
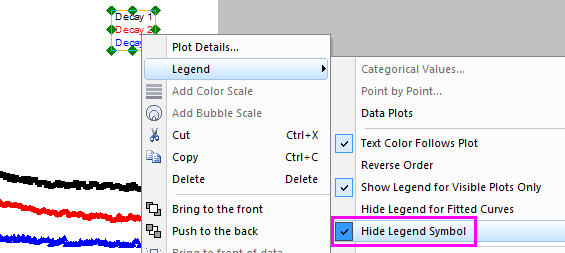
| ORG-14396 | Hide left symbol part in Legend via context menu |
|
| ORG-15346 | Support %(?, @xx), %(?x, @xx) for Custom Column Name or Label or Custom Layer Banner | %(1, @LA), means the Y column long name of 1st plot %(1X, @LA), means the X column long name of 1st plot When there is a connection between tick and plot(major tick type=By plot column label. The position setting of plot is set to auto or the same column label of major tick type. ), ? means the related plot. Otherwise, ? will use the setting of Data Plot Index for Auto Axis Titles in Page level. |
| ORG-15292 | Categorical legend improvement related to connect line | For Box plot, if the connect line color of data points indexing by a column, Legend:Categorical values dialog should show Line Color checkbox, select it will show the categorical info of connect line. |
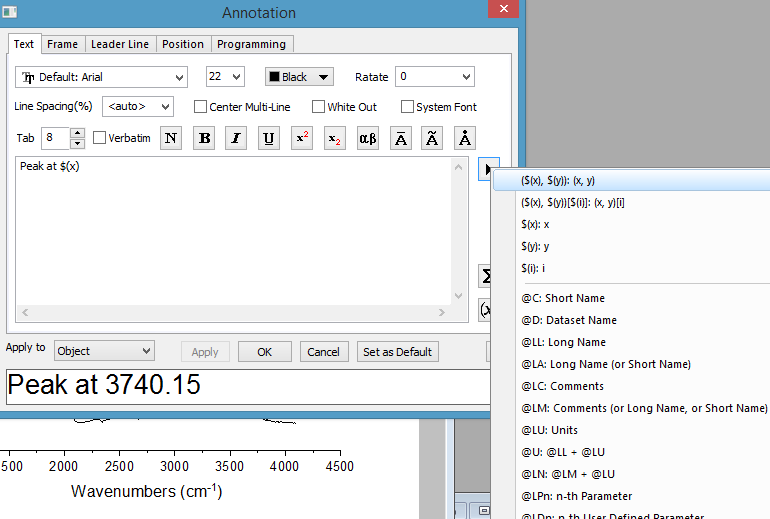
| Annotation Improvements |
| |
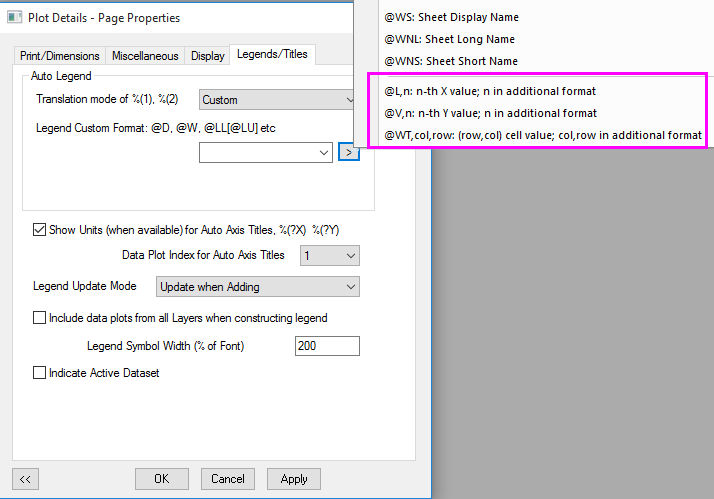
| ORG-14565 | Additional global custom legend format | For Plot Details and Updat Legend dialog, add 3 more entries as a separate group, when Translation mode of %1,%2 is set to Custom, to show the value of a praticular row or cell for each plot in the layer. @L,n: n-th X value; n in additional format @V,n: n-th Yvalue; n in additional format @WT,col,row: (row, col) cell value; col, row in additional format
|
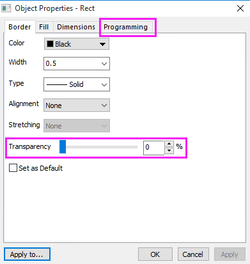
| ORG-5537 | Simple consolidated Object Properties dialog for all graph objects | Properties dialog and Programming dialog are combined to a simple consolidated Object Properties dialog. Users are able to control transparency features of graph objects in Object Properties dialog. A new system variable is added to enable/disable old Object Properties/Programming dialog:@OPD: (0/1, default is 0), 0 to disable, non-zero to enable.
|
| ORG-13876 | Improvement of copying Multiple Graph Objects | Copying multiple graph objects where layer has Fixed Factor != 1 or Scale with Layer Frame (and layer resized) may cause the objects to loose their scaling in the previous version, that is fixed in Origin 2017. |
| ORG-14835 | Add legend support for Connect Data Symbol | When user select Data in Box Chart Component and Connect Data Points, the Connect Line show with symbol in legend. |
| ORG-14397 | Update for Legend Symbol Width(%) | Setting the Legend Symbol Width to 0% in Plot Details dialog (Legend/Titles tab), whole legend symbol will not be drawn. |
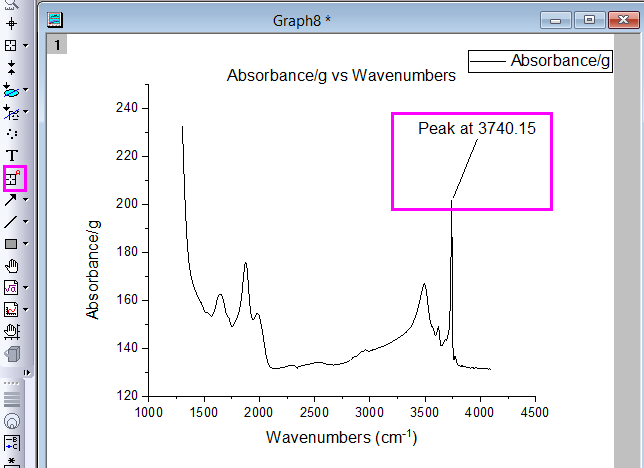
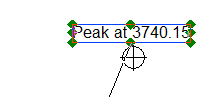
| ORG-16104 | Add an option to control the start of leader line of the label | For labels generated by label tab, we can change the gap between symbol and the start of leading line by "set %C -gtl 0". |
| Set Color Fill Transparency for Text Object (SR1) | When Text object has Frame turned on, user can set fill color transparency to get this effect:
| |
Allows half-point font size such as 10.5, etc. (SR1) | In the past, font size in graph could only be set as integer. | |
| Better default for square ended line and rectangle objects (SR1) | Default values of the following system variables are changed in Origin 2017 SR1
New system variable @lcr (default is 1) to set the cap of rectangle or legend or text frame | |
| ORG-15278 | Use only category legend and auto update (SR1) | Add a option for Categorical Legend update dialog named Use only category legend and auto update. When it's checked, you can change the Makes filter and see plot and legend updated accordingly. |
Plot Manipulation
JIRA | SUMMARY | DETAILS |
|---|---|---|
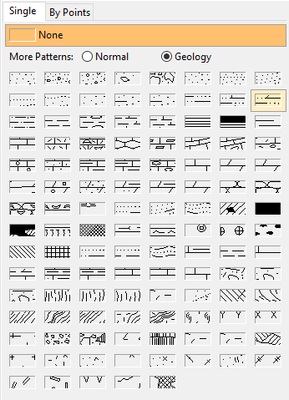
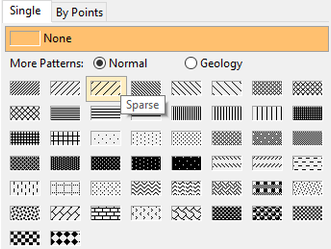
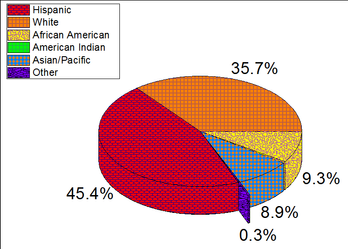
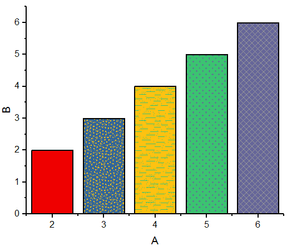
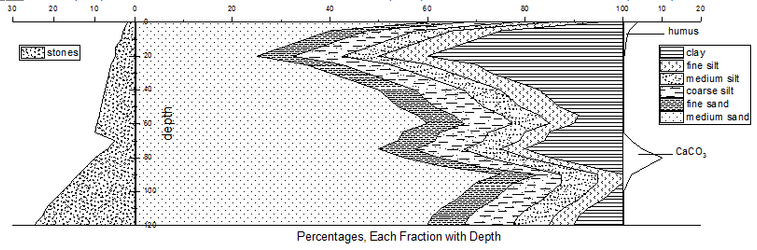
| Support hatching in contour plots for geologists, geophysicists, civil engineers and more fill patterns are added | In Plot Details dialog, Geology fill patterns are added in GUI as well as more normal patterns. Users are able to customize different hatching in contour plots, pie charts or area plots.
| |
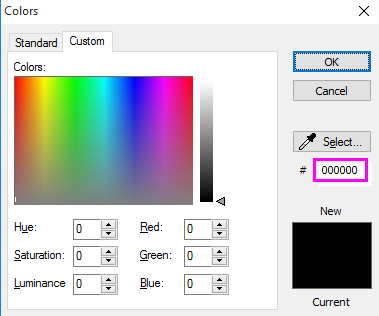
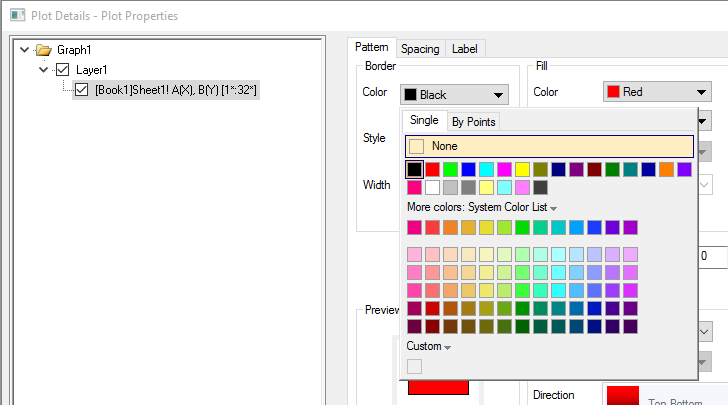
| ORG-14775 | Easier way to change custom color | Click color blocks in Custom color to open Color dialog, then easily enter HEX code to set custom color.
|
| ORG-14518 | Provide none color for border line | Add option to select none color for border line
|
| Better color scheme for graph system theme | We have used our default black, red, blue, green color scheme for many versions. Some users felt the default are not good. A new system theme Candy Colors & Light Grids is created so when plotting common 2D graphs, e.g. line, scatter, line+symbol, column/bar, box chart, etc. the new color scheme will be used. Note: All 3D graphs and some 2d graphs don't allow system theme to override so when plotting those, it will still use the old color scheme and color palette. | |
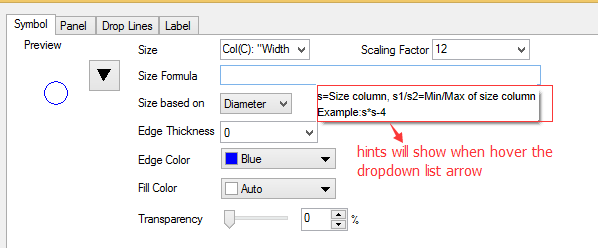
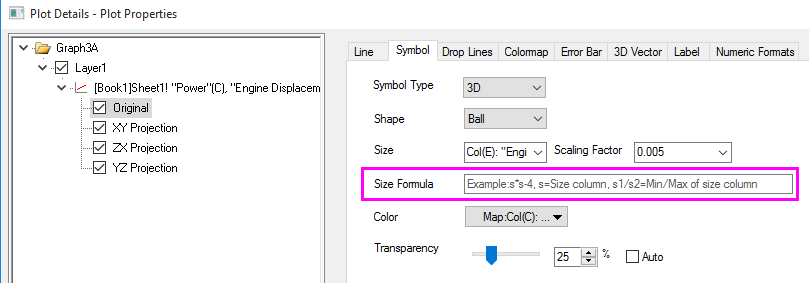
| ORG-14593 | Map symbol size to an expression of a column | Sometimes the values in Size Column are very similar and user can't see the size difference. E.g. all are big values, etc. With Size formula, user can specify some math expression based on values in Size column.
|
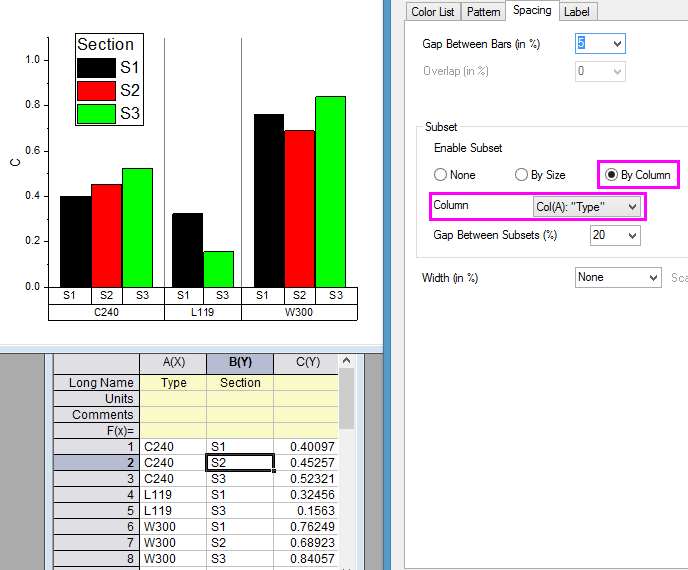
Subgroup control in Unbalanced Grouped Column Plot
|
| |
| Adjust sub-group spacing between subgroups of stacked column plot |
| |
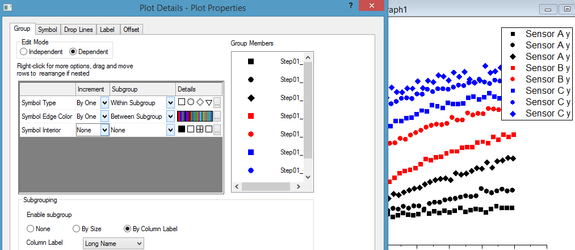
| ORG-13699 | Control how each plot attributes increment in subgroups of a group plot |
|
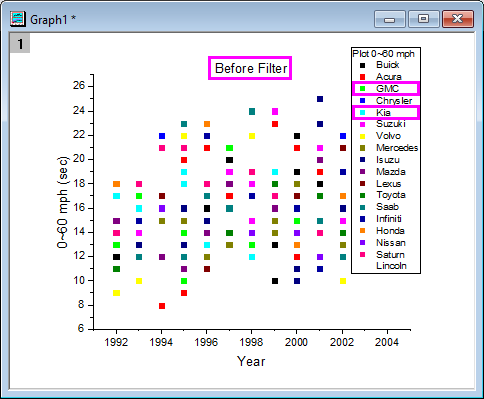
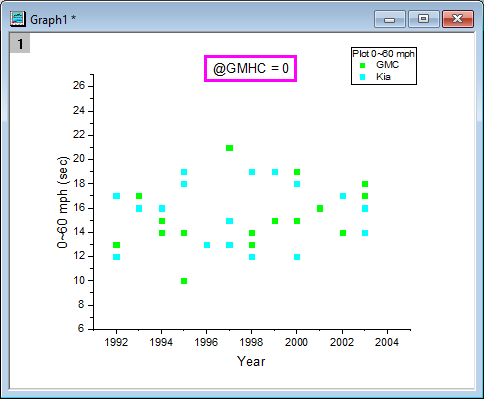
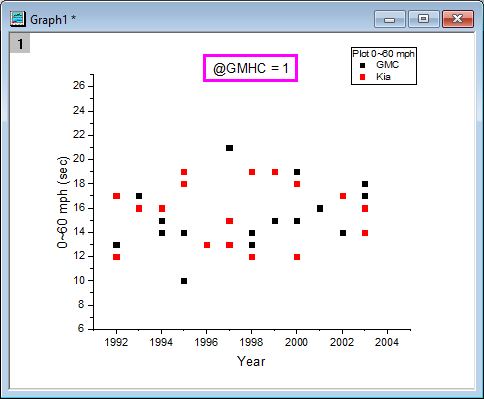
| ORG-14212 | New system variable added to define filtering with categorical data | Before filtering, please notice that GMC and Kia's color is Green and Cyan. With new system variable @GMHC, users are able to control whether keep original legend color or not. @GMHC = 0, means filtered data legend remains the same color as before filter, while @GMHC =1 means not.
|
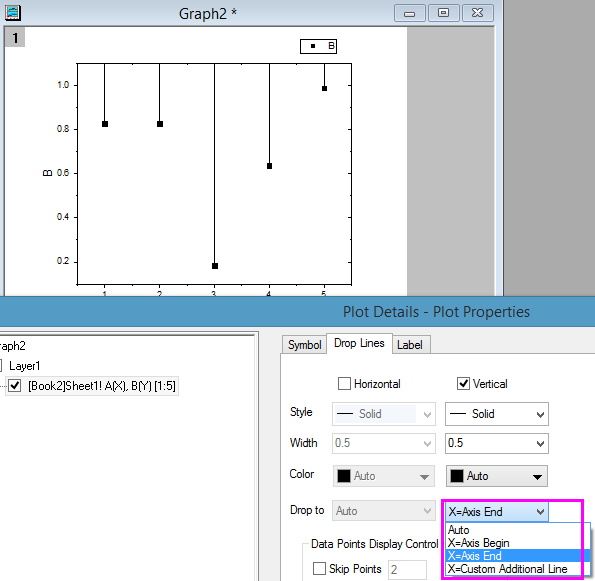
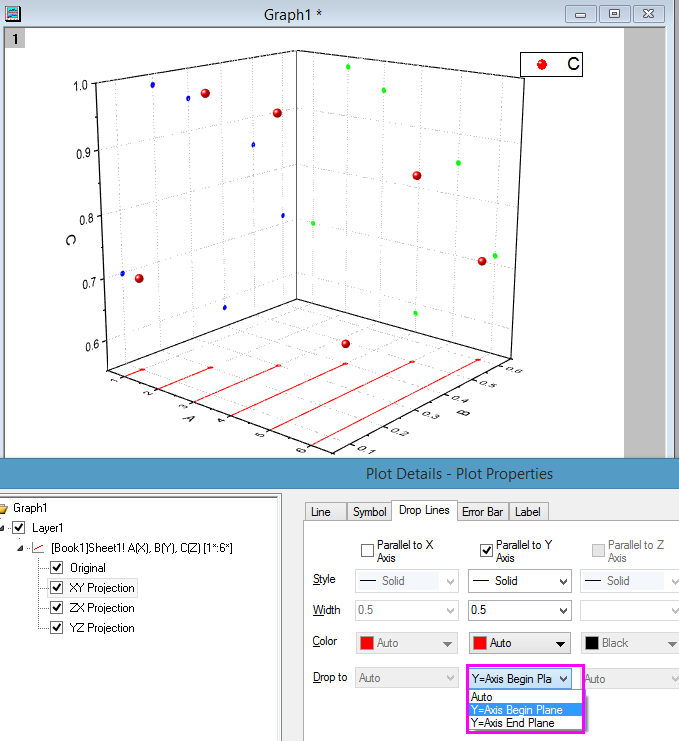
| ORG-14444-S1 | Dropline Direction Control in 2D and 3D graphs |
|
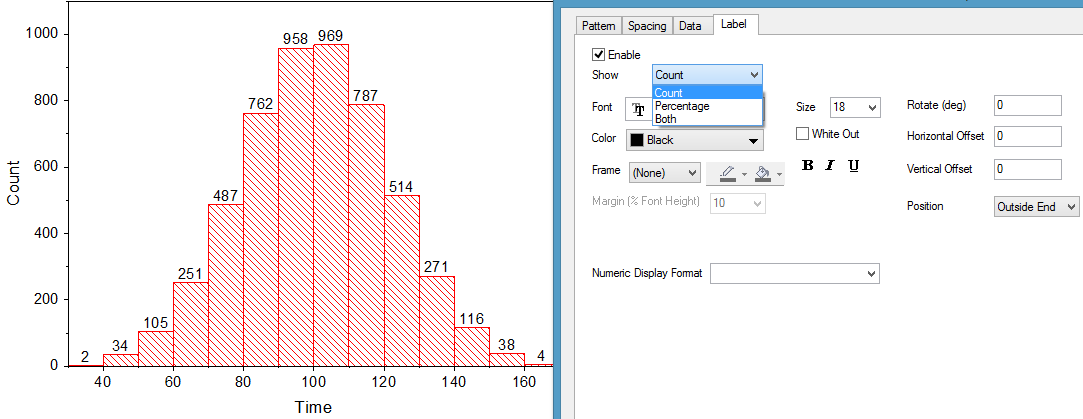
| Histogram Plot with Bin Counts or Percentage as Labels | Label tab is added in Plot Details dialog turn show Count, Percentage of both for Histogram plot.
| |
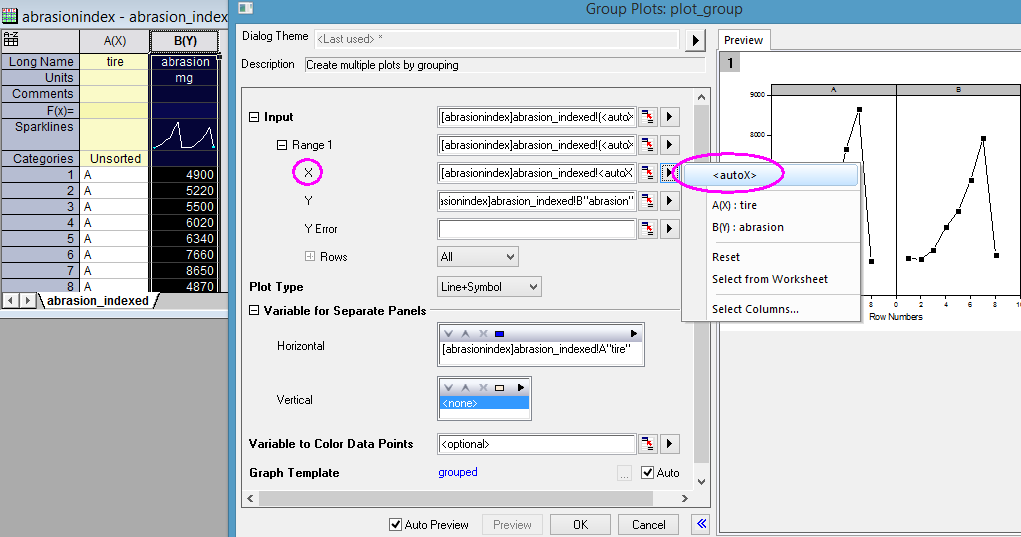
| Add AutoX as a fly-out option for Input:X in Plotting dialog | For some plot types, Origin will open a dialog first for user to specify input and settings before plot is made. E.g. Trellis Plot, Stacked Plot, Grouped Column Plot - Index Data, etc. In Input node, user can specify X to be <autoX> if user wants to plot against row indexing
| |
| ORG-13552 | Allow users to change the line color for Line Series plot | Improve Line Series plot to allow users to change the line color. |
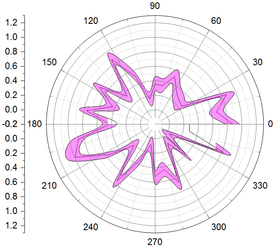
| ORG-12765 | Support Error Bars with Fill Area in Polar Chart |
|
| ORG-13835 | Support color mapping for inclusive broken option | Fill Area now works for both inclusive and exclusive broken if have modifier. |
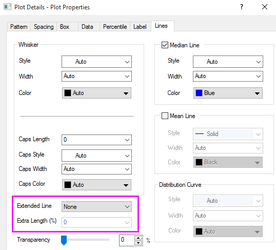
| ORG-14760 | Improvements for Box plots customization. | Improve auto coloring for lines inside box so that it will be shown as contract to the box fill color. Two new system variables are introduced: @BAC: (default 1) works just like @DLC @BACM: (default 1) to control the behavior of auto Add an option to adjust the length of box chart line.
|
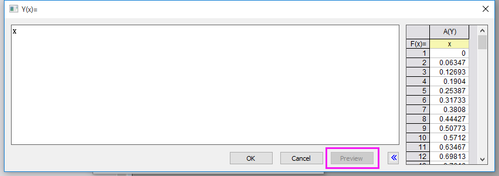
| ORG-14117 | Improve debugging of Function plots | In both Function plot dialog and Function tab of Plot Details dialog of a function plot, undefined variable will be indicated in red. In addition, underline will be added to script when it interrupts. In Y(x) dialog, add a Preview section that shows a table with two columns showing the actual XY values.
|
| ORG-15389 | Update default speed mode threshold for 2D and 3D data | Increase the default speed mode threshold for key templates. |
| Add a built-in Graph theme All Axes On (SR1) | User can use it to easily turn all axes on in 2D Cartesian coordinate graphs. | |
Better Increment List control of different plot types when plotting multiple data together.(SR1) | When selecting multiple datasets and plot together, Origin will group them and use increment list of color, shape, etc. to distinguish them. In the past, user can set e.g. color list in Graph system theme so all graphs will have same color list. The disadvantage of this is that for different plot types, this may be not appropriate. E.g. for line plot, it's better to use some dark color list, while for column or area plot, it's better to use some light color lists. In Origin 2017 Sr1,
| |
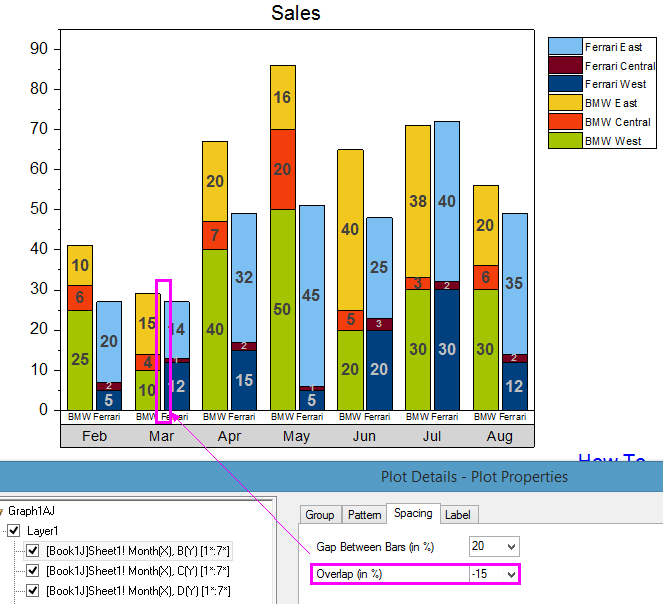
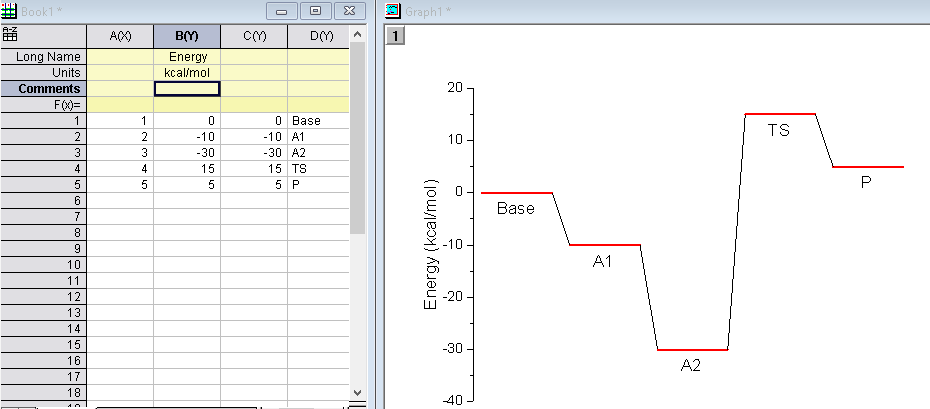
Improvements in Floating bar to better make plotting the following kind of Energy Diagram easier. (SR1) | See more http://originlab.com/forum/topic.asp?TOPIC_ID=26067 User has X, Y and Label Data and wants to plot line+symbol graph but show each symbol as a horizontal bar and the lines should connect edges of the bars. It's hard to implement for Line+symbol graph since the line always connect to center of the points, plus even if implemented, horizontal bar width isn't adjustable. We made the following improvements in Origin 2017 Sr1 so that user can achieve this by floating column graph. Add Bar Graph show Zero Values checkbox on Graph tab of Tools: Options dialog to show an horizontal line if floating bar from and to values are the same. page.BarShowZero=-1 (follow Tools: Options settings) , 0 (do not show), 1 (show) Support connect lines between floating column/bars. Open Plot Details dialog. Select Layer on left panel. Go to Stack tab. Check Show Connect Line on Stacked/Floating Column/Bar checkbox. This checkbox was only working for stacked column/bars and was called Show Connect Line on Stacked Column/Bar in the past. User can go to Spacing tab to and set Gap Between Bars to adjust bar width.
|
Graph Page and Layer
JIRA | SUMMARY | DETAILS |
|---|---|---|
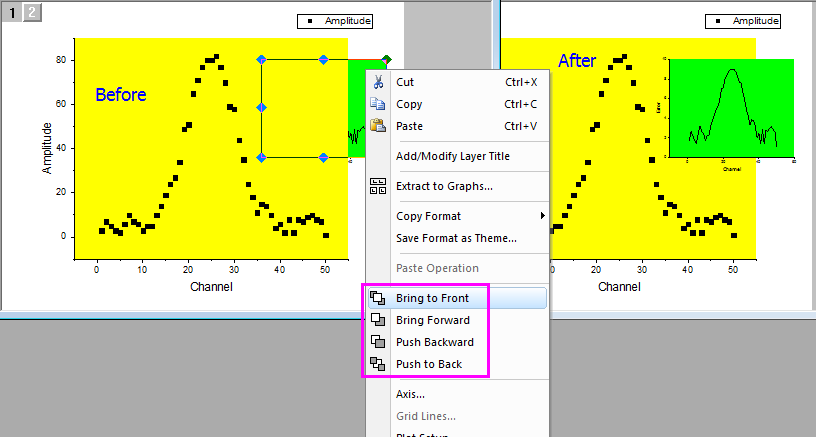
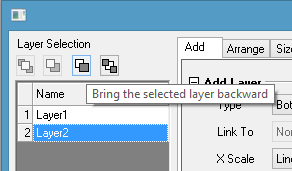
| ORG-14137 | Easier way to push change layer drawing orders. |
|
| ORG-13470 | Exchange XY of Linked Layers together | In the past, if user has linked layers, such as Double Y, Multi-Y, multi-panel graphs, etc., when click Graph: Exchange X-Y Axes, it only changes current layer's X-Y axes. They are exchanged together now. |
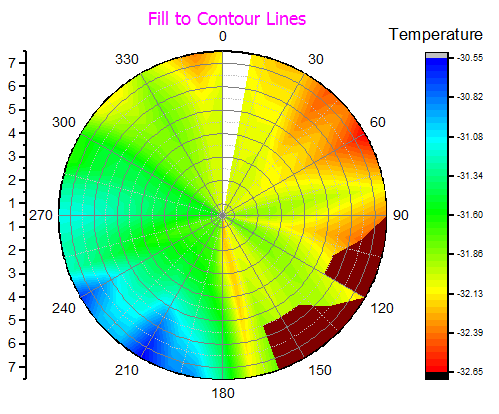
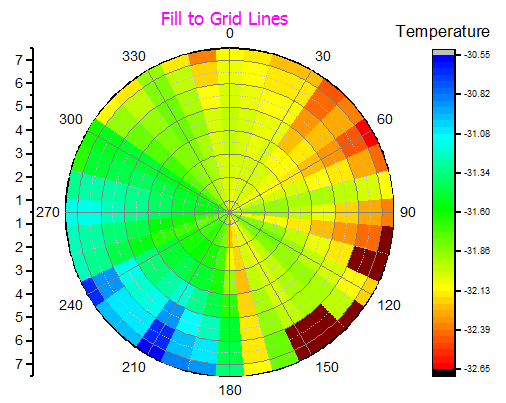
| ORG-13834 | Support Fill to Grid Lines in Polar Contour | The default color fill setting for Polar Contour by Matrix is Fill to Contour Lines. Additional option is added as Fill to Grid Lines in Colomap/Contours tab . |
| ORG-14416 | Better options for Merge Graphs | Enable Merge Graphs toolbar button when active window is workbook since user can merge embedded graphs in workbook. When Merge Type is Specified, enable ... button for for embedded graphs. |
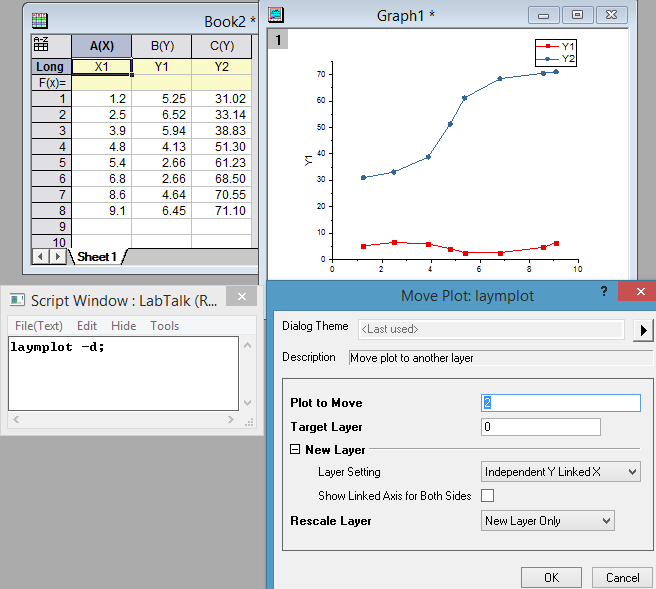
| laymplot X-Function is added to move plot(s) to new y axis/layer (SR1) | Many times, user asks how to move a plot to right Y axis. Before Origin 2017 SR1, user needs to move the plot from existing layer, add new layer with right Y axis. Then add plot to it. In Origin 2017 SR1, we added an X-Function so it's much easier. With graph window active, choose Window: Script Window In Script Window, run Specify which plot(s) you want to move, e.g. 2 means 2nd plot. 2 4 means 2nd and 4th plots. Click OK to move it. Note: Plot customization such as color, etc. can't be moved to new layer. So we recommend move plot(s) first and then customize plot in each layer. |
Axis
JIRA | SUMMARY | DETAILS |
|---|---|---|
| Drag text in tick label table to adjust height of width of table | In the past, the table row width/height is minimize to wrap the text in it. There is no way to adjust the offset. | |
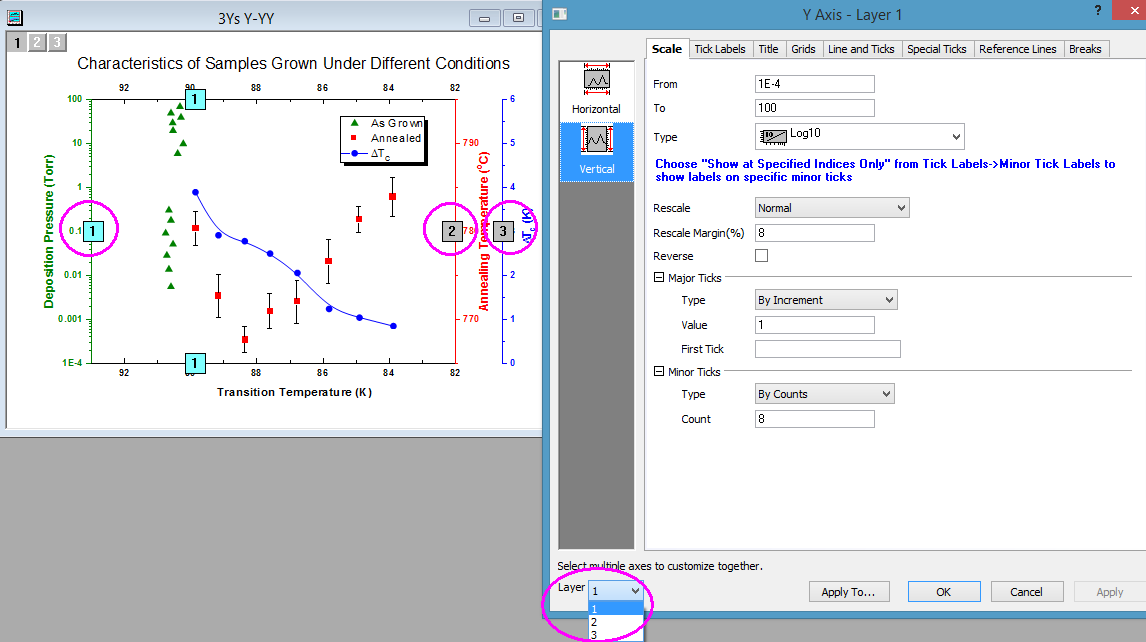
| ORG-10204 | Switching Layers in Axis dialog | For multi-layer graph, user can open axis dialog and edit different layer's axis. See the layer dropodwn list on the upp-left corner of the axis dialog. In the past, user has to close the dialog and open the correct layer's axis dialog.
|
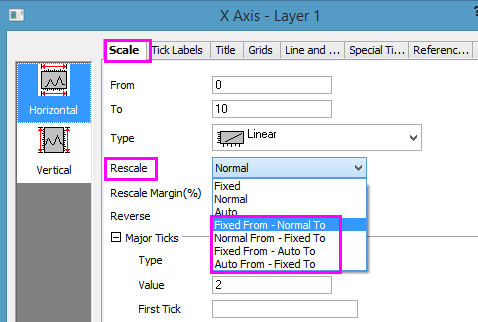
More options in Rescale dropdown list on Scale tab | If user want to fix the From value and auto rescale axis when new data comes in, please choose Fixed From - Auto To. Our old Fixed From option is now renamed Fixed From - Normal To, since it fixes from value. And not rescale to value till user click rescale to show all.
| |
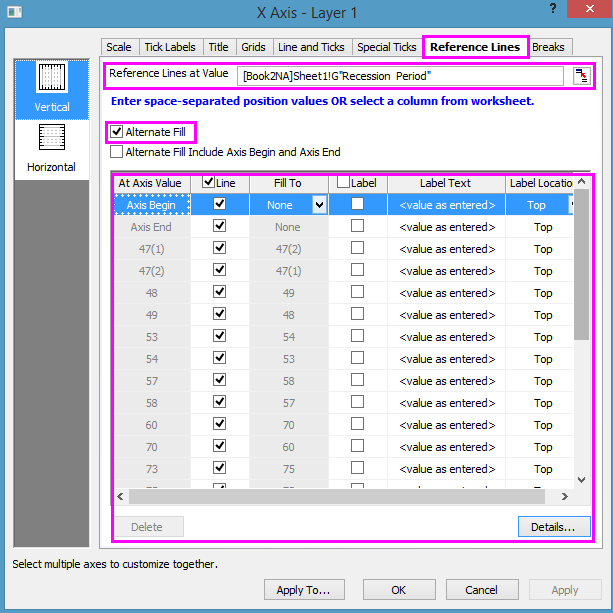
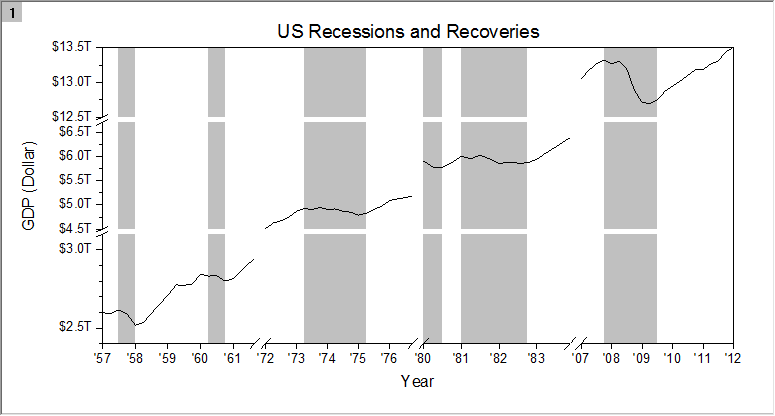
Easy way to add multiple reference lines and share in between. | References tab is added in Axis dialog
| |
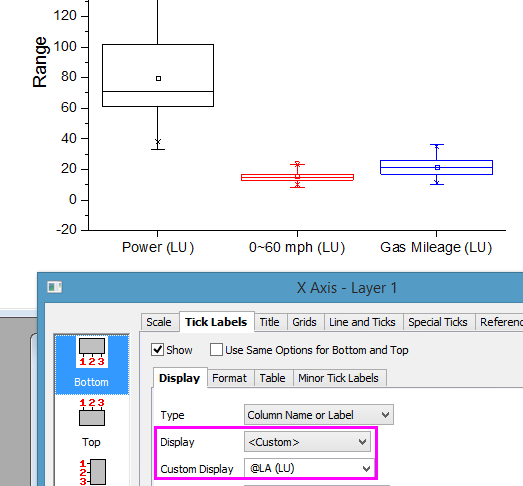
| Set tick label to be a combination of column labels. | E.g. to display Long Name (Units), set Custom Display to be:
| |
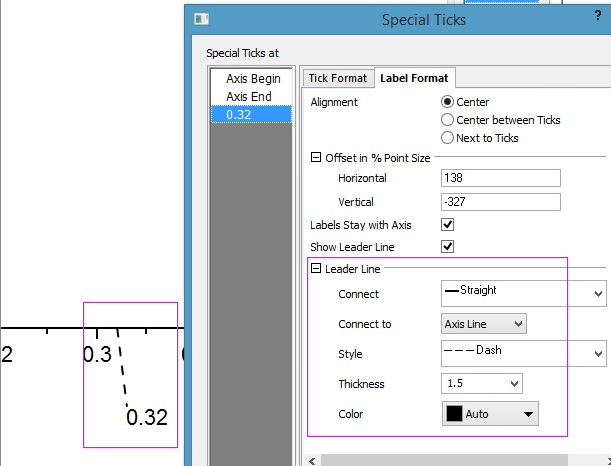
| Leader Lines for Special Ticks |
| |
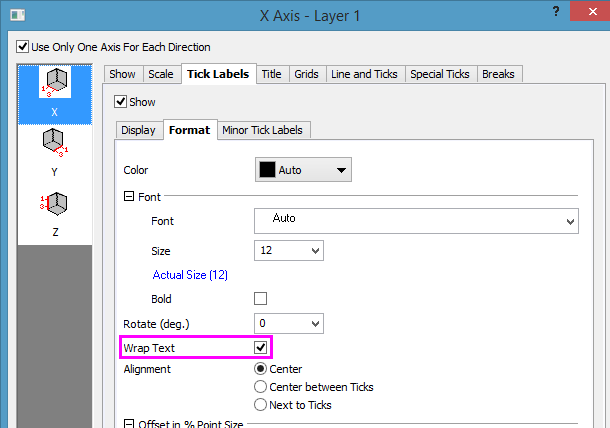
| ORG-14615 | Wrap tick labels in 3D graphs | Supports tick label wrapping for 3D graphs to display long tick label better
|
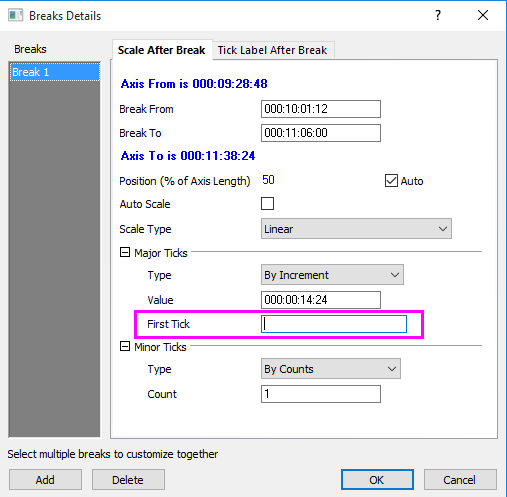
| ORG-14560 | Improve the custom-positioned ticks after break | Add First Tick option at the end of Break Detail: Scale after Break: Major Ticks Branch to specify the first tick after break.The Custom Position box supports the standard format of date and time data as well.
|
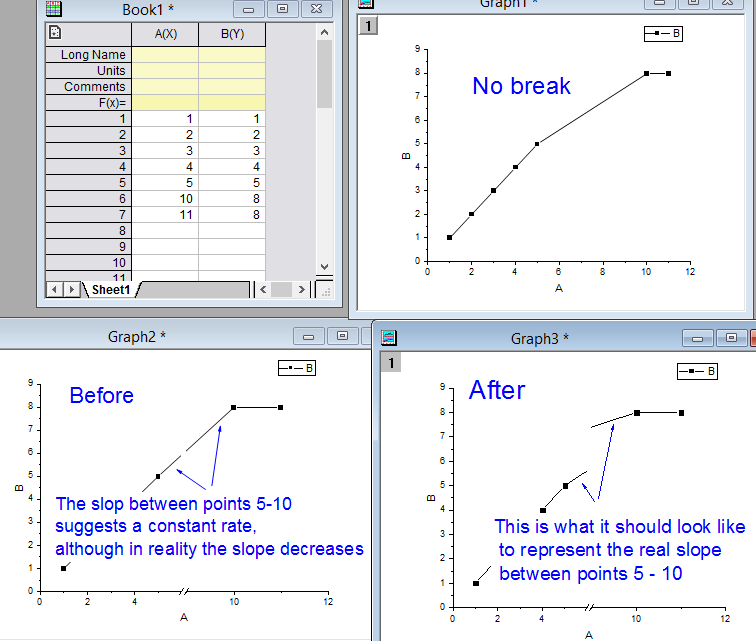
| Keep line slope through axis breaks | Run page.breaktype = 1 represent real slope before and after break | |
| Support Copy and Paste Reference Line to another graph. | ||
| ORG-7901 | New axis dialog | New Axis dialog for Radar, 2D Waterfall, Smith Chart, Polar, Ternary and 3D Ternary. To use old Axis dialog, turn off bit 0x00000010 of @ADL. |
| White Out support for Tick Labels (SR1) | White Out checkbox is added on Format subtab of Tick Labels tab in Axis dialog |
3D and Contour
JIRA | SUMMARY | DETAILS |
|---|---|---|
| 3D Bar plot different shape for XYY and XYZ bars |
| |
| ORG-14444S1 | Dropline Direction Control in 3D graphs |
|
| ORG-14444S2 | Origin doesn't support 3d bars in projected planes. But user can turn on dropline and set big line thickness to make the dropline looks like bars. But in previous versions, dropline end cap will show as semicircle. Orgin 2017 added system variable @lc3p to control it. | @LC3P=-1, Default. Old behavior. Semi-Circle @LC3P= 0, compatible with OLineCap. Round @LC3P= 1, Square @LC3P= 2, Flat With this feature, users are able to use thick dropline in projection plane as 3D bars on projection. |
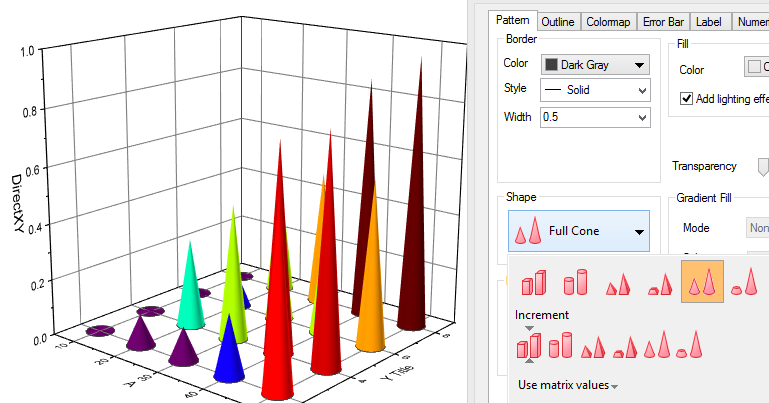
| Group plots in 3D | The following plot types are supported
So user can easily set group increments of plot attributes | |
| ORG-8720 | Support stacked XYY 3D bar graphs | The following plot types are supported
Improve stack plots with the following features
|
Support all 2D objects in 3D OpenGL graph, such as |
| |
| ORG-14500 | Enable Bubble Scale for OpenGL(3d Scatter) | Size formula not only works for 2D graphs but also works for 3D OpenGL graphs, user can specify symbol size using some math expression based on values in Size column. |
| ORG-14699 | Enable Reconstruct Legend toolbar button for 3D plot | Users are able to add and edit legend for 3D plots using Reconstruct Legend toolbar button. |
| ORG-14629 | Support 3D Stack Bars with multiple objects from matrix sheet | Support plotting all matrix objects together from active layer for 3D Stack Bars plot. |
| ORG-14656 | Support Button object for 3D graphs | Support Button object for 3D graphs. |
| Add hot keys to easily do rotation and resize in 3D graphs instead of using control buttons with layer frame selected (SR1) | Click anywhere inside layer frame to select the layer. Then 1. "tab" to switch among the operation buttons (the last fix position button is not operation type) . | |
| ALT+dragging annotation in Contour graph (SR1) | Alt+Drag annotation to new location is supported in Contour graph now. | |
Analysis
JIRA | SUMMARY | DETAILS |
|---|---|---|
| General: Not save mask info. in Analysis template by default | Save Analysis template will not save masking info. in input data since mask should really be associated with the data. To save mask in template, set @atcm=0 | |
| General: Improvements on Results Log output (SR1) | Output quantity names in results log are consistent with names in dialog E.g. Integrate tool. names used in results log are very simply, e.g. y0, x0, dx and user doesn't know what quantities they are. They are actually "Maximum Height", "X Value in Maximum Height" and "Peak Width at Half Height". So now in SR1, the Results Log output names contains both e,g. y0 (Maximum Height) = 15.6239.... | |
| General: Ignore hidden columns on analysis (SR1) | In the past, if we hide a column and then make a plot or do analysis, the graph or analysis result still contain the data which belongs to the hidden column(e.g. may not show in graph, but just unchecked). In Origin 2016, we could directly ignore the data in hidden column when making a plot. And now, if we do analysis using tools with input as XY Range or XYZ Range, such as Average Multiple Curves, Nonlinear Curve Fit, Nonlinear Surface Fit tool, the data in hidden column will not show in the result. | |
| ORG-16290 | General: Output sheet should be locked (SR2) | For operation that output result to a whole worksheet and locked, following operations are disallowed on the result sheet.
|
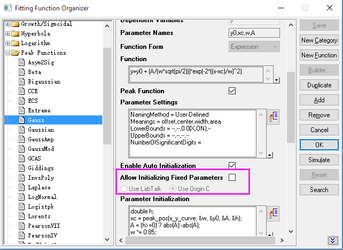
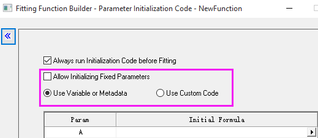
| Fitting: GUI changes on allowing initialize fixed parameters | In Fitting Function Organizer dialog (F9), add a checkbox "Allow Initializing Fixed Parameters" (default unchecked) above Parameter Initialization editbox; inFitting Function Builder dialog (F8), add a same checkbox on Parameter Initialization Code page, under "Always run Initialization Code before Fitting". This checkbox is designed to allow initialization code to modify the fixed value. When it is on, initialization code can read/write the values for fixed parameters.
| |
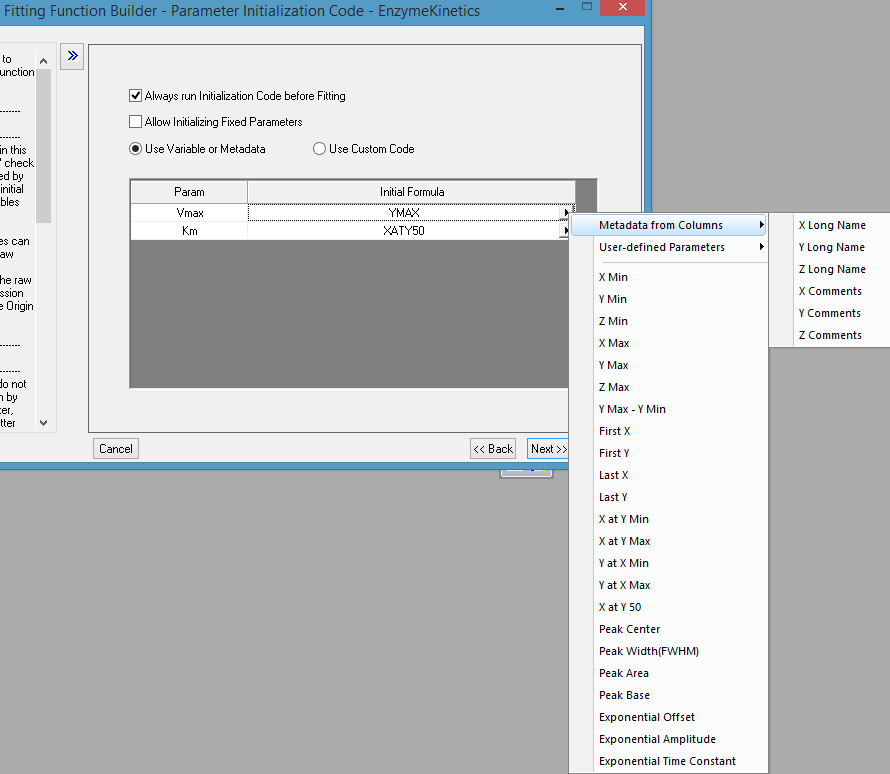
| ORG-1651 | Fitting: Easier Initial Formula for parameters in Fitting Function |
|
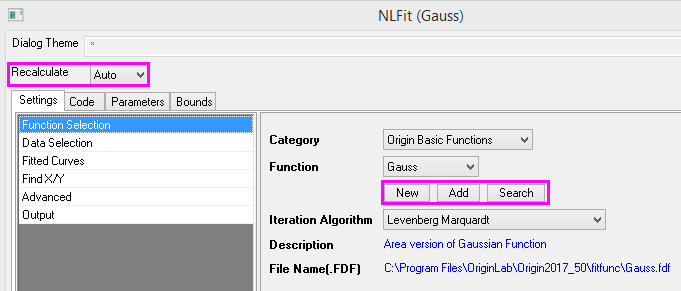
Fitting: New, Add and Search function buttons on Settings → Function Selection tab. Show Recalculation Mode dropdown list above all tabs |
| |
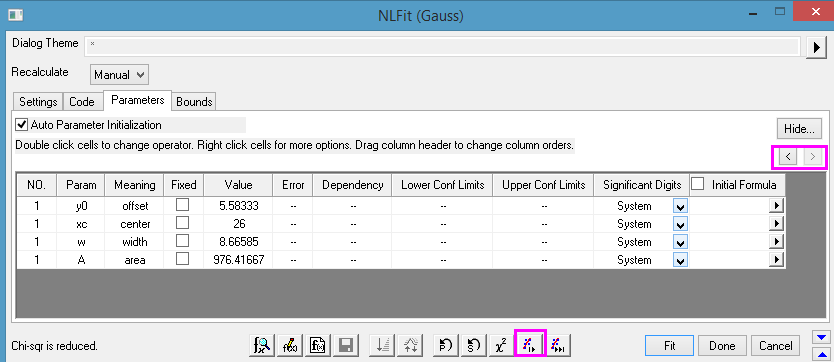
Fitting: < and > two buttons in Parameters tab to switch between sets of parameters to compare fitting result E.g. if you click 1 Iteration multiple times, you can click < and > buttons multiple times to see parameter value changes. |
| |
| ORG-14335,ORG-14417,ORG-14964 | Fitting: More Built-in Fitting Functions | Add more Exponential association fitting functions with time offset parameter: ExpAssoc1, ExpAssoc2, ExpAssocDelay1,ExpAssocDelay2 under Exponential category. Add three fitting functions for Photosynthesis Irradiance (PI) curve : PIPlatt, PIPlatt2, PIWebb under Exponential category Add 3d Curve Functions: Helix and Line3 under in Multiple Variables category. |
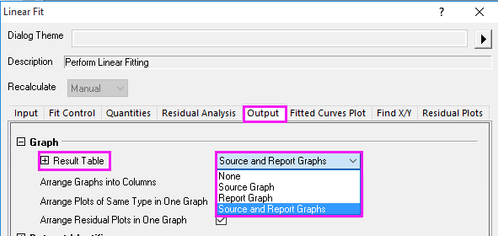
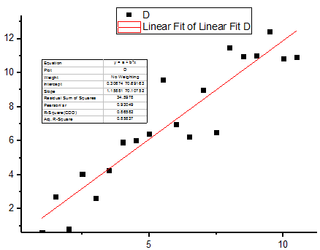
| ORG-15001 | Fitting: Add result table for embedded report graphs | Users now have options to add result table to embedded report graphs, no matter whether fit was done from worksheet or graph.
|
| ORG-13201 | Fitting: Compare Model supports global fit | Compare Model now supports comparing the results from Global Fit. |
| ORG-15050 | Fitting: Update built-in FittingWithExternalDLL example with VS2012 | The old example was based on VC6 and didn't show how to create 64 bit version. A new example has been updated using VS2012. |
| Statistics: Two Way ANOVA supports Means Plot | Two Way ANOVA supports Means Plot | |
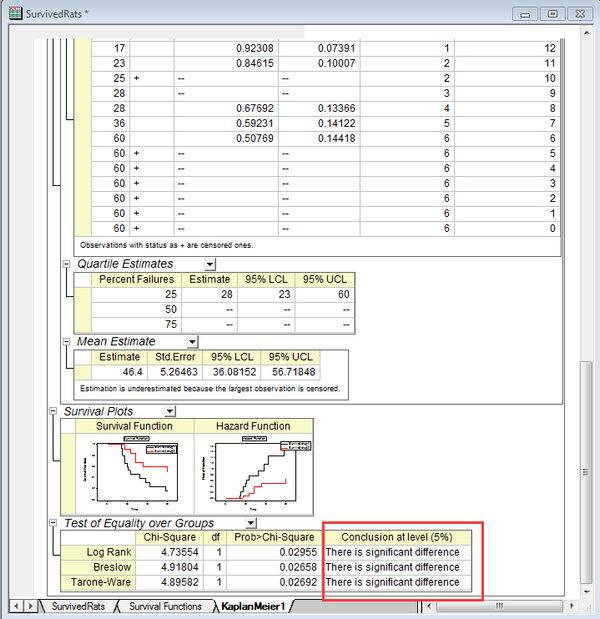
| Statistics: Add conclusion to survival analysis, distribution fitting (Good-of-fit test) |
| |
| ORG-16047 | Statistics: Improvement for Power and Sample Size, One-Way ANOVA (SR1) | Power and Sample Size, One-Way ANOVA adds Maximum Difference between Means option for Specify Group Means Difference. |
Data Processing
JIRA | SUMMARY | DETAILS |
|---|---|---|
ORG-15402 S1 |
|
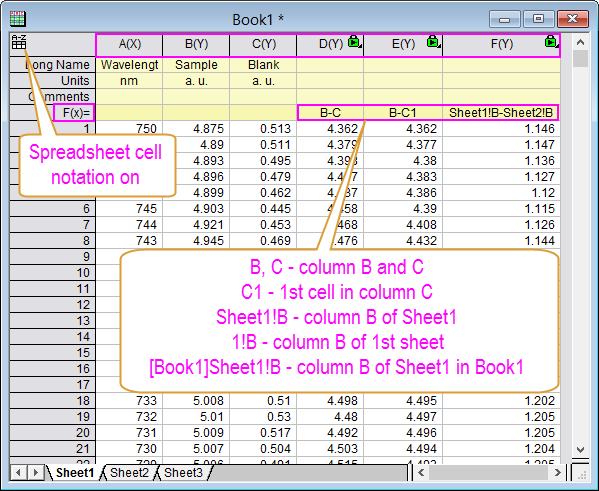
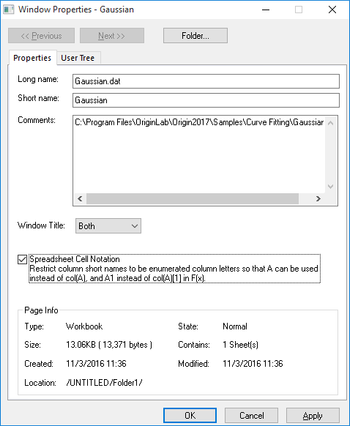
A new properties is added to Page object. Use page.xlcolname to control the Spreadsheet Cell Notation in current Workbook window. A new macro clrx is added to globally turn off the Spreadsheet Cell Notation in Origin. Once the macro has been run, the Spreadsheet Cell Notation will be always off even restart Origin. @RCN can be used to enables or disables spreadsheet cell notation (SCN) in the workbook.
Note that bit values are additive (e.g. @RCN = 7 means cell notation is Auto On for conforming analysis tools (4), import follows active book(2), and SCN is ON for all new worksheets from toolbar(1)). |
| ORG-10977 | Formula updates when related column position is changed with Column Short Name Restriction is on | System variable @DEFU = 1 to disable automatically update formula and return to the old code. |
| ORG-14364 | Improve F(x) row support | Lower case i and j refer to row number and column number respectively, while upper case I and J refer to column I and J respectively. Lower case letter, except for i and j, will be converted to its upper case automatically matching the existing column. New system variable @AUN = Auto UpperCase Name is added and default is 1 = ON. XLColName is not only available to LabTalk script but also available in OriginC now. |
| ORG-14394 | More samples for custom data filter | In Custom Data Filter dialog → Filter → Load Samples list, add the following statistics filters
|
| ORG-14498 | Treat Hidden Rows as Skipped | In previous version, hidden row is treated as missing value. Now we improved it to treated as skipped by default. System variable @GMH has been changed to have 3 options: -1 (default), 0, 1. -1 means to follow the hidden rows option on Worksheet Properties dialog. Almost all analysis tools are well support hidden rows now. Please note that, when creating output, the output data will be placed in visible rows on destination sheet only. For LabTalk access, hidden row is not considered in previous version. Now we changed it to follow the @GMH value, which meanshidden rows will be skipped by default. |
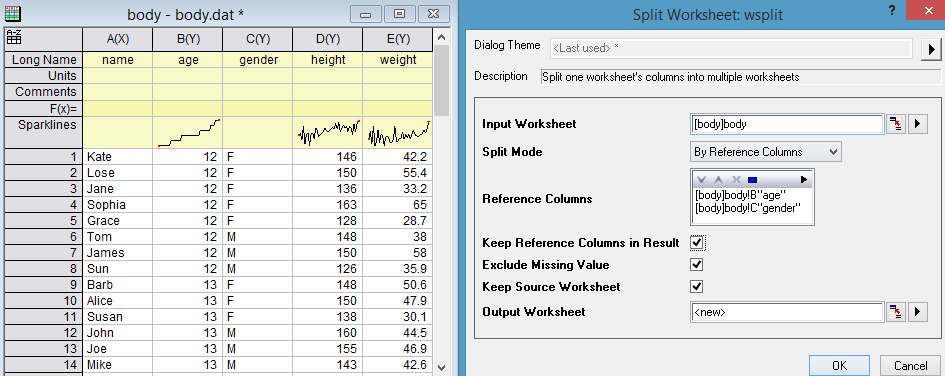
| ORG-11259 | Split Worksheet by values in reference column(s) | Split worksheet by reference columns in
|
| ORG-14333 | Speed up deleting columns or workbook to a large extent | Deleting thousands of (non-contiguous selected) columns or even a large worksheet no longer takes a very long time. |
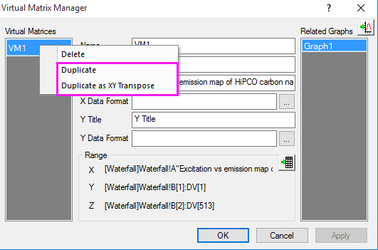
| ORG-14661 | Support for Virtual Matrix duplication and transposing | Allow to duplicate or duplicate as transpose context menu in the Virtual Matrix Manager dialog
|
| In workbook make it easy to add User Parameter row or move contents to it (SR1) | User may not know they can they can right click on column label row header to add user parameters. In Origin 2017 SR1,
| |
| Split worksheet Improvement (SR1) | Support splitting partial range in worksheet. When splitting worksheet, user may only want to show some columns in the result sheets. In the past, all columns will be kept in result sheets which will not really needed and will cause slowness. Allow presetting result sheet names. In the past, the result sheets were named as Sheet1, Sheet2, etc. Now a new option is added so user can preset the result sheet name. For example, use reference column's values, or dataset name, etc. as sheet name. | |
| Support This keyword in Set Column Values dialog (SR1) | When turn on Spreadsheet Cell Notation in workbook, user can use This keyword in Set Column Values dialog to indicate current column itself. E.g. Total(This) will calculate the sum of current column. Also, This can have numeric suffix for cell reference, so This1 is the 1st cell, similar to A1. In Set Column Values dialog, This keyword is also added under the Variables menu for easy access. | |
| ORG-15968 | Matrix Image Crop on multiple object (SR1) | Support cropping on multiple matrix/image objects in the same matrix sheet. |
Importing
JIRA | SUMMARY | DETAILS |
|---|---|---|
| Excel Import: New Excel Import dialog without using COM support | Excel Import has been redone and no longer relies on the COM for import of *.xls and .xlsx/.xlsm files. In practical terms, this means that you no longer have to have MS Excel installed to import your Excel files into Origin. It only supports "Excel 97-2003" and "Excel 2007 and later" | |
| Excel Import: New Excel Import dialog without using COM support | Excel Import has been redone and no longer relies on the COM for import of *.xls and .xlsx/.xlsm files. In practical terms, this means that you no longer have to have MS Excel installed to import your Excel files into Origin. It only supports "Excel 97-2003" and "Excel 2007 and later" | |
| ORG-12950 | Excel: Import: Avoid DDE message if linked Excel is open inside opj | Skip Excel DDE dialog if the linked Excel is open inside opj as well as the opj contains no Excel book that is not relative. |
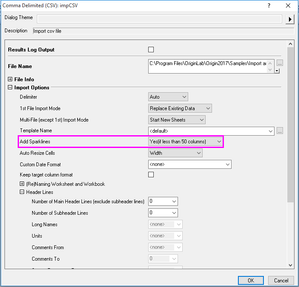
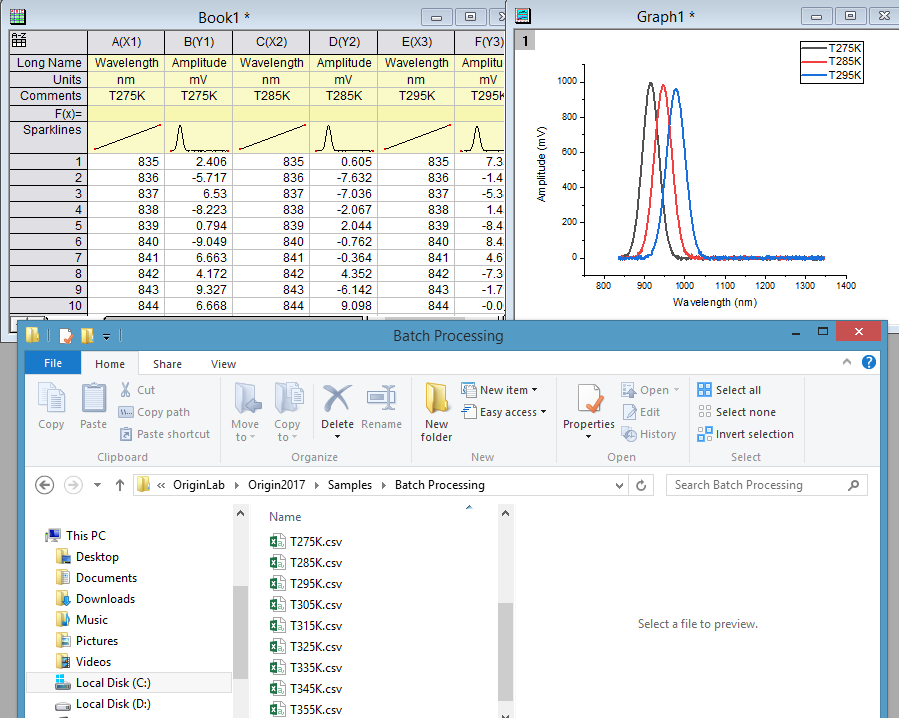
| ORG-14358 | CSV Import: Support Sparklines for CSV import | For CSV import, Sparkline is turned on by default.
|
| ORG-14502 | JCAMP Import: Import more metadata when import JCAMP file | impJCAMP is improved to keep more metadata from the imported book. |
| ORG-15565 | TDMS Import: Improve precision of importing tdms file | More accurate on converting system time to julian date. |
| ORG-14608 | Better third party file meta data import support | Better treenode name for file info. |
| ORG-14505 | Short name will not be modified from import tools | Proper handle metadata so that column short name will not be affected when "Excel-like column short name restriction" is ON. |
| ORG-14611 | Prompt Workbook Organizer for checking Meta Data | A smart hint will be shown. |
| ORG-6175 | Support import multi-channel .wav file (SR1) | Data in multi-channel wav file can be imported in Origin Note: Partial Import and meta data(long name ect) have not been supported yet |
| ORG-14420 | Support appending file name without extension as column Comments (SR2) | From SR2, when user choose Append Filename to Column Comments in the import setting, the file name will be appended without extension. Note: To revert back to old way, use system variable @IFE=0
|
Exporting and Presentation
JIRA | SUMMARY | DETAILS |
|---|---|---|
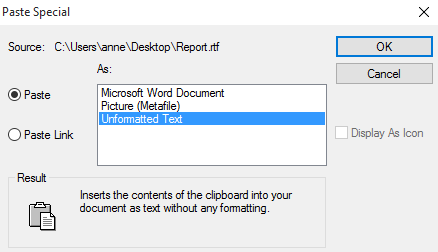
| RG-13992 | Support paste plain text when copy text from other applications like Office | Add Unformatted Text option in Edit - Paste Special dialog to allow user paste plain text when copy text from other applications like office.
|
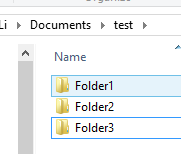
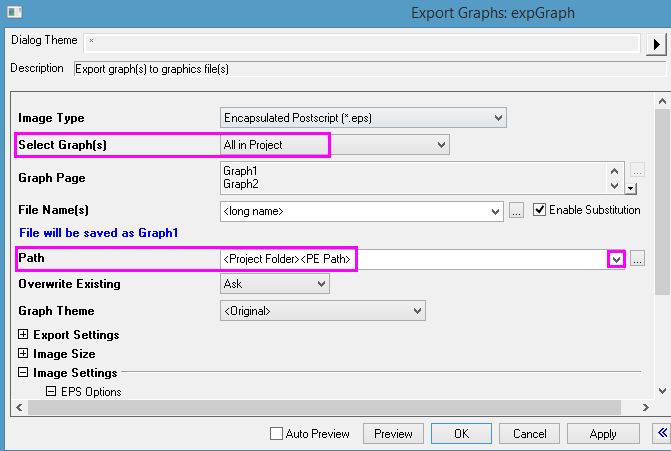
| ORG-14682 | Export graphs in subfolders of project to corresponding subfolders under project File folder in Windows Explorer Suppose i have test.opj with graphs in Folder1, Folder2 and Folder3 subfolders. I can directly export all graphs in project to corresponding subfolders under test\ folder in Windows Explorer.
| Suppose user has graphs organized in multiple subfolders in a project. When export graph, choose Path to <Project Folder>\<PE path>. Exported graphs will be put to corresponding subfolders in OPJ file folder.
|
| ORG-14664 | Hide Adobe Illustrator graph export | Adobe Illustrator (*.ai) is hided by default as an exporting image type option. If users want to edit graphs in Adobe, Enhanced MetaFile (*.emf) export is recommended. Or set system variable@HAI = 0 to show Adobe Illustrator option. By default @HAI = 1. |
| ORG-14505 | Short name will not be modifed from import tools | Proper handle metadata so that column short name will not be affected when "Excel-like column short name restriciton" is ON. |
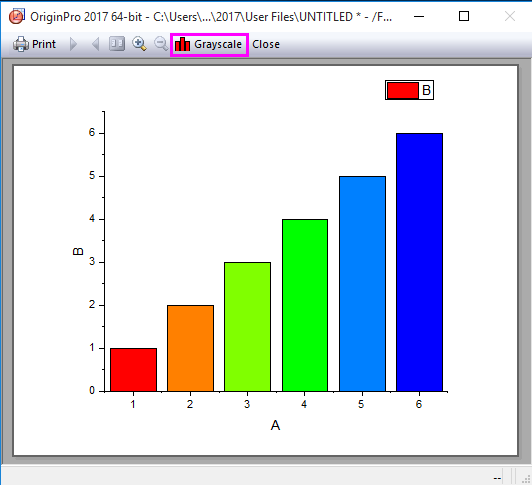
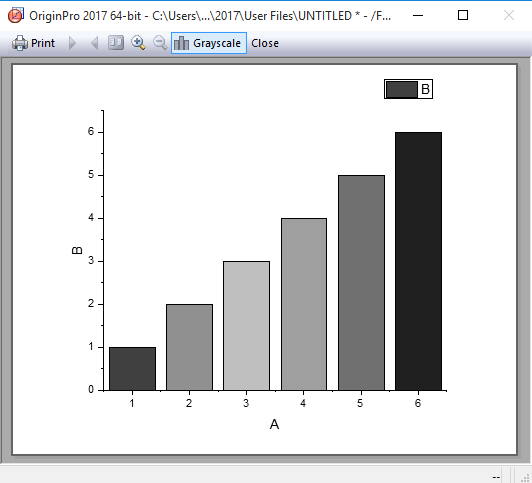
| ORG-14774 | Add Grayscale button in Print Preview | Add Grayscale button in Print Preview to help users to check the B&W effect of graphs quickly.
|
Batch Processing
JIRA | SUMMARY | DETAILS |
|---|---|---|
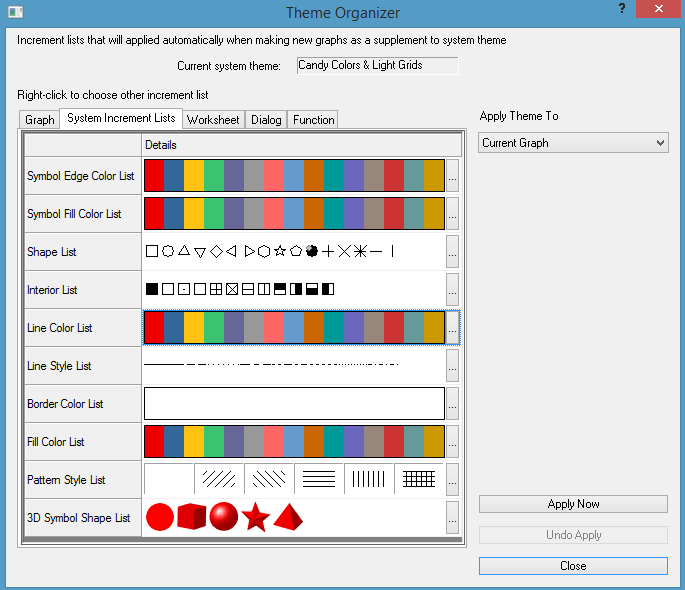
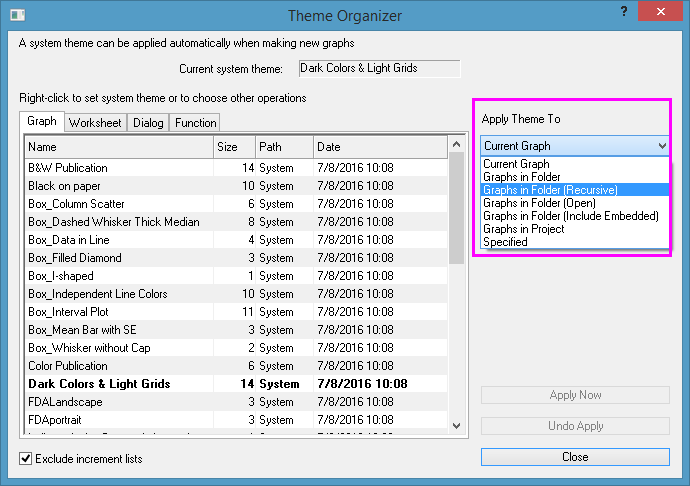
| Apply graph theme to all graphs in subfolders and specified graphs only | In the past, in Theme Organizer, user can only apply graph theme to Current Graph, Graphs in Folder and Graphs in Project. More options are added for user to apply theme to subfolders, embedded graphs, or specified graphs only.
| |
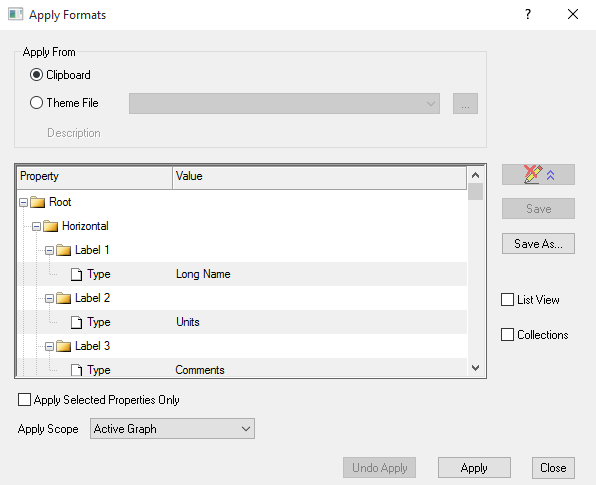
| ORG-14419 | Copy/Paste Format improvements | Add an option Paste Format (Advanced)... in both Edit menu and context menu of graph to allow user open Apply Formatdialog.
|
| ORG-14899S2 | Batch plotting allow lower level meta element | Extend the batch plotting with option to duplicate plots from specified source. |
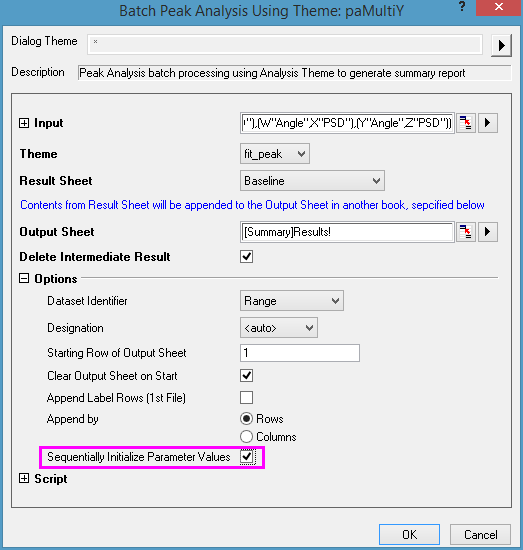
Sequentially initialize parameter values in batch peak analysis |
| |
| Add match modifiers by option to Batch plotting dialog (SR1) | This option will affect the Match Modifiers by option of new created clone graph. But it should not affect the option of source graph. | |
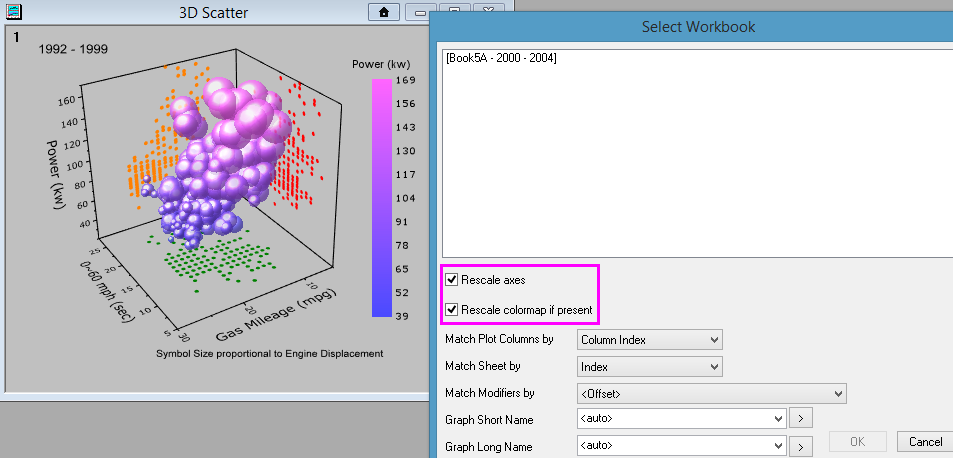
Rescale Axes and Colormap Controls during Batch Plotting (SR1) |
|
Project and Data Management
JIRA | SUMMARY | DETAILS |
|---|---|---|
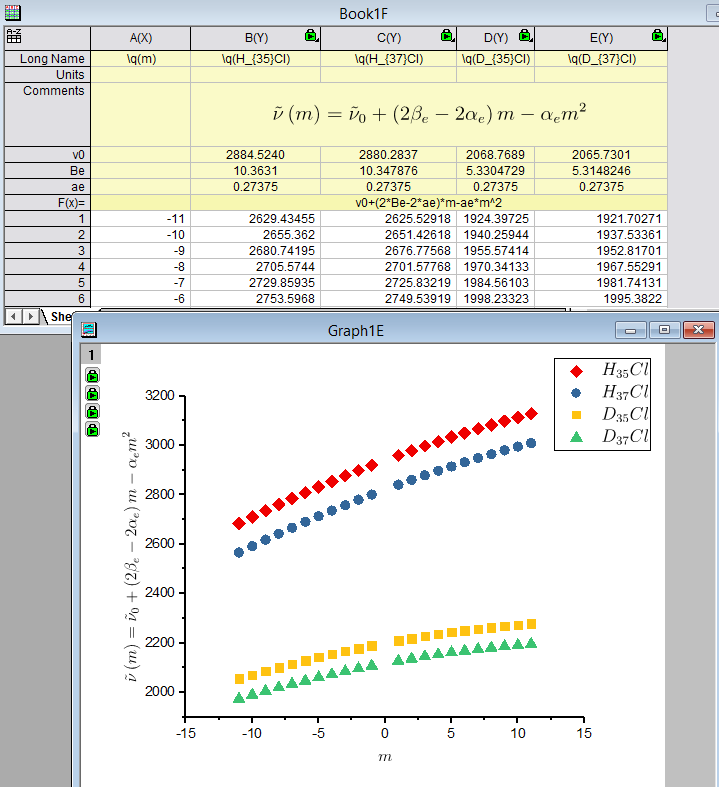
| Add Latex in Axis Title and Legend | Try 2017 LaTex \q() escape sequence for LaTex, e.g. \q(\alpha+\beta) Double click Axis Title and then click LaTex app to add LaTex Add Raw LaTex in worksheet column long name, units, comments, etc and see them in legend and axis titles in graph. Right click column label row header and set Style to Rich Text to see LaTex in worksheet.
| |
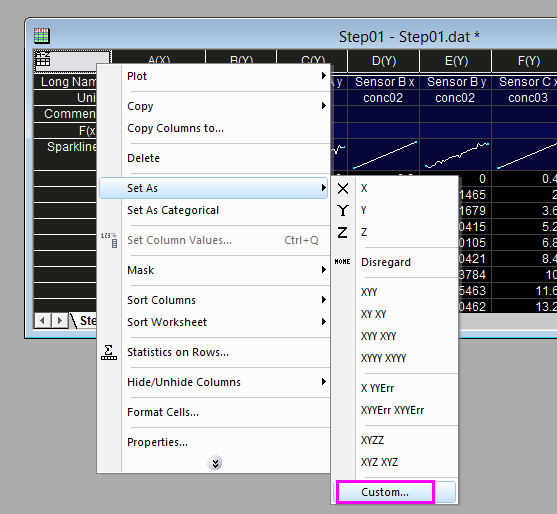
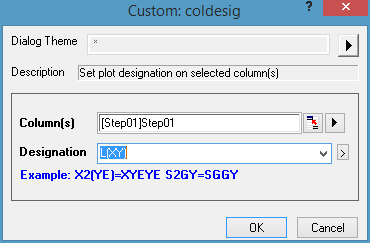
| Allow customize column designation bySet As context menu or Column menu. | Right click multiple columns and choose Set As: Custom... to customize the column designations E.g. L(XY) will customize columns to Label X Y X Y ... This syntax is also used in Import dialogs. () means repeat.
| |
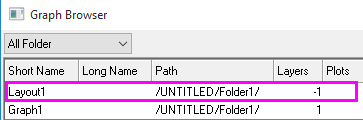
| ORG-14604 | Embed layout in worksheet | Support layout for Graph Browser so that not only graph but also layout could be added or inserted through Add Graph as Sheet, Insert Graph (into a cell) and Insert Graph toolbar button.
|
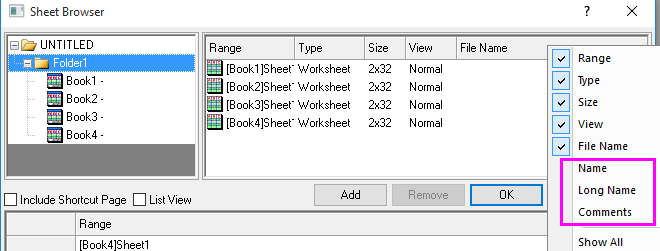
| ORG-14395 | More options for displaying sheet name in Worksheet Browser | Add 3 more columns: "Name" (i.e SN), "Long Name", and "Comments", by default hidden, to better distinguish different sheets.
|
Programming and Connectivity
JIRA | SUMMARY | DETAILS |
|---|---|---|
| OC: support for dialogs using HTML and Java Script | We have added support for dialogs using HTML and Java Script. Brief explanation on the examples and how to execute them:
| |
| ORG-14540 | OC: Easier way to open specific page of CHM file | Origin C GETN supports opening specific page of CHM file. X-Function supports opening specific page of CHM file by ID. |
| ORG-14499 | OC: Provide Origin C function to get the number of major ticks | To get the number of major ticks in a graph, call Origin C function: int GetAxisTickData(vector& arrTicks, int nType = OC_MAJOR). This function returns arrTicks size; if fails, return -1. |
| ORG-15364 | OC: Allow saving opj while dialog is up | Add Origin C command to save the active project BOOL Save( LPCSTR lpcszFilename = NULL, BOOL bRename = true) |
| ORG-14652 | OC: Support color setting for the wizard navigator in Origin C | Allow users to change the background color in the navigator control of a wizard in Origin C |
| OC: OC Function to Convert HTML Color to OCOLOR (SR1) | Add a new OC function okutil_HTML_to_ocolor(LPCSTR lpcsz) to convert HTML color string (e.g. "#00FF00") into Origin OCOLOR. | |
| ORG-14343 | Labtalk: Support passing over vector string to StringArray when calling X-Functions using LabTalk | All dataset variables in LabTalk used to be numeric. "dataset -a name" is used to create a StringArray dataset for users getting dataset names back from X-Functions. |
| ORG-14660 | Labtalk: Support more LabTalk options for Fill Area Under Curve | Support more options for set -pfv command in LabTalk. For example, Fill to next data plot - one color is now can be generated using "set %C -pfv 8; set %C -pf 1;". Note: set fill mode first then turn the fill area option on. To control fill to next mode, use "set %C -pfn nn;" where nn = 1 for Common X Area and nn = 2 for Area Enclosed by End Points. |
| Labtalk: wclear XF adds ability to clear label area | It is mapped to a new bit CWOD_CLEAR_LABEL_ROWS allowing clear the label area. | |
| ORG-10621 | Labtalk: LabTalk command added to set fill pattern by name | set %c -tb -PFPN "filenamewithoutext" |
| ORG-13891 | Labtalk:Create LabTalk callable function to calculate the great-circle distances between two points. | double HaversineDistance(double lon1, double lat1, double lon2, double lat2, double r, bool bDegree) This function takes the longitudes and latitudes of two points on a sphere with radius r, returns the great-circle distances between them. Option degree determines whether to use degree or radian as the unit of longitudes and latitudes. |
| ORG-15402 | Labtalk:LabTalk command to save a system variable same as entering into the system variable dialog | add_sys_vars function is added which needs to be used after run -oc, like run -oc add_sys_vars XCA|RCN 0|0 macro clrx is now defined as doc -e WW {page.xlcolname=0;};run -oc add_sys_vars RCN 0; |
| ORG-15339 | Labtalk: LabTalk command to hide/show image thumbnails | page.activedataIndicator=0; //hide image thumbnails |
| Labtalk: page level variables v1 to v4 (SR1) | Introduce page level variable page.v1$ ~ page.v4$ (both numeric and string are supported), User can use it to associate a variable with a page. One example: User has multiple workbook and user want to define a workbook level variable to use in set column value calculation. E.g. in Set Column Values dialog Write page.v1=1.1; in Before Formula Script In Formula box, enter e.g. page.v1*A to get the product of column A times this v1 variable. | |
| ORG-16265 | LabTalk access for Show at Specified Indices Only of plot label (SR2) | New switches are introduced to access the Show at Specified Indices Only option for plot label in set/get command. Syntax:
|
| Python: Support adding permanent system path for Python. | When external Python is installed, their path will be added to the embedded Python path list. | |
| Python: Update Origin to latest Python | Python version is upgraded to 3.5.2 and 2.7.12. | |
| ORG-14696 | X-Function: Improvement on X-Function framework | Support tab-changing event and tab style for X-Function bar. |
| ORG-2968 | Mathematica Link: Support communicate with individual instance of Mathematica | Update sequencer.exe to 64-bit so that users are able to work between Origin and Mathematica (v7,v9,v10). |
| ORG-14759 | ocz file support pro only and current user only | Add two checkbox pro only and current user only in in password dialog when creating new ocz file. |
Other
JIRA | SUMMARY | DETAILS |
|---|---|---|
| Undo support after customizing graphs in Plot Details dialog | After closing Plot Details dialog, Ctrl+Z or Edit: Undo to undo the changes. | |
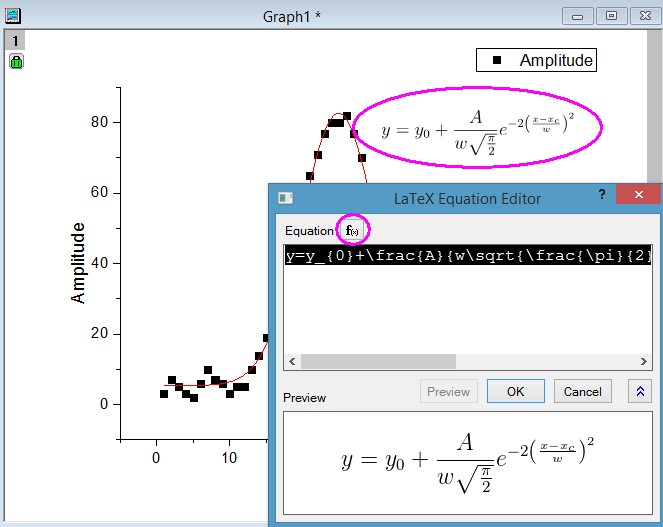
| ORG-15213 | LaTex App Improvements | Download and Install 2017 LaTex App Support Latex in Axis title, legend, worksheet column label area
In LaTex Equation Editor, click f(x) to load Latex equation of fitting function |
| New Apps | •Manhattan Plot for GWAS •General Linear Regression (PRO) •Means Plot (PRO) •3D Stacked Histograms (PRO) •Enzyme Kinetics (PRO) •Piecewise Fit (PRO) •Logistic Regression (PRO) •Simple Time Series Analysis (PRO) •Principal Component Analysis (PRO) … and more | View more apps: www.OriginLab.com/Apps
|
| ORG-15211 | System Variable:The read-only system variable @OLCID is added | New system variable @OLCID is added to return the locale of the resource which Origin is currently running. In English mode @OLCID = 1033; in German mode @OLCID = 1031; in Japanese mode @OLCID = 1041. |
| ORG-14689 | System Variable:Remove system variable OCSE | New generated OP files will be encrypted. Remove the way to generate un-encrypted OP files. |
| ORG-16137 | System Variable: Add a system variable to disable MRU menu (SR1) | A new system variable @MRU is added to disable the most recent used menu item. Default is @MRU = 7, means all enabled.
|
| ORG-16188 | System Variable: Add a system variable to control closing down (SR1) | A new system variable @EC is added to control the closing procedure. Default is @EC = 0, means exiting Origin normally.
Note: @EC can be a combination of these controlling bits to produces cumulative effects. |