Proportion Testing in Hypothesis Testing (Pro)
The following tests are accessible from the Statistics: Hypothesis Testing menu
One-Sample Proportion Testing
Two-Sample Proportion Testing
How to
Suppose a pill A is administered to 27 patients with a particular disease. And finally, 17 improve. The doctor wants to test whether this drug is as good as another pill B, which is known to produce improvement in 50% of patients.
Start with a new empty worksheet
Select Statistics: Hypothesis Testing: One-Sample Proportion Test
If you already have summarized data, select Summarized for Input Data From drop-down list.
Fill in the Number of Success, Sample Size.
Check for Confidence Intervals to calculate Confidence Intervals, Binomial Test to also do test by Fisher exact method and Actual Power to do power.
If you only have raw data, you can also specify a column to be the source data of Sample, and then select the value of success for Success drop-down list.

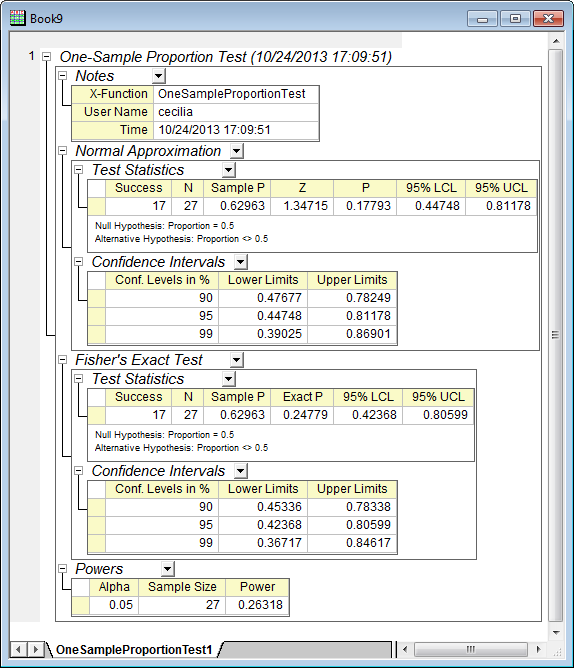
The Test Statistics table in Normal Approximation section shows that sample P-value, about 0.63, is larger than the hypothesis proportion 0.5, and the test P-value, about 0.18, is larger than level 0.05. Thus, we should reject the Null hypothesis.
The Binomial Test method gives test P-value 0.24779, which also helps the doctor to reject the Null hypothesis. In fact, further testing would show that pill A is better than pill B.