Arrange graph of same type in one graph in applicable statistics
- Snow Li
- Wall-E
- Meili Yang (Unlicensed)
- Sam Fang
Owned by Snow Li
Last updated: Nov 07, 2017 by Wall-E
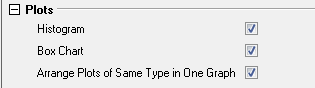
In Statistics tools that will generate plots, such as histogram or box chart, it's nice to show the same plot type in one graph so user can compare them in same scale.
So we added Arrange Plots of Same Type in One Graph checkbox under Plots node for those statistics that applies, such as those one or two sample t-test, paired t-test, etc.
, multiple selections available,