Multiple Special Ticks and Other Tick Label Improvements
Sample OPJ to download to try: Multi breaks and Other Axis Related.opj
Multi-Special Tick Labels
How to:
| |
Major and Minor Ticks by Space Separated Numbers
On Scale tab, choose Major Ticks or Minor Ticks to be By Dataset, user can type space separated numbers as major/minor ticks.
layer.x.ticksbydata$="10,12,20 28"; //LT script to set major ticks
layer.x.mticksbydata$="11,15,23"; //LT scirpt to set minor ticks
Tick Labels on Minor Tick Indices Only
In 9.1, user can show tick labels on specified minor tick indices. This is especially useful for log10 scale axis.
E.g. On log10, major ticks are at 1, 10, 100, etc., by default we show 8 minor ticks. User can set Minor Tick Indices to be 2 5 so 2, 5, 20, 50, etc. tick labels will show for 2nd and 5th minor tick indices.
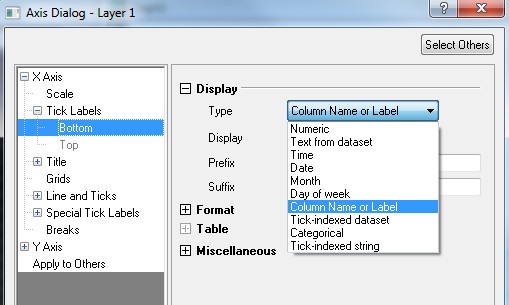
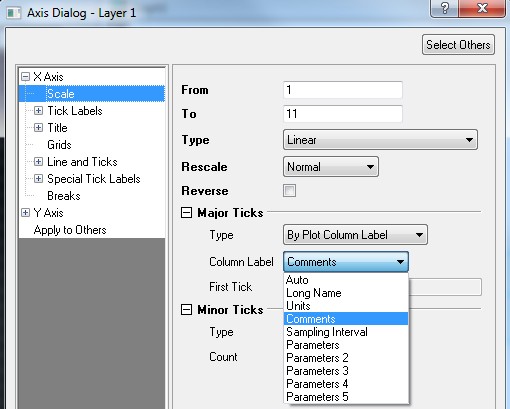
Major Ticks by Column Label Row

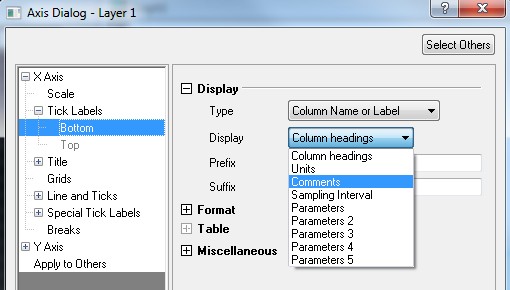
Tick Labels by Column Label Row