Origin 2017 Graphing Miscellaneous
Plotting Customization
| JIRA | SUMMARY | DETAILS |
|---|---|---|
| Better color scheme for graph system theme | We have used our default black, red, blue, green color scheme for many versions. Some users felt the default are not good. A new system theme Candy Colors & Light Grids is created so when plotting common 2D graphs, e.g. line, scatter, line+symbol, column/bar, box chart, etc. the new color scheme will be used. Note: All 3D graphs and some 2d graphs don't allow system theme to override so when plotting those, it will still use the old color scheme and color palette. | |
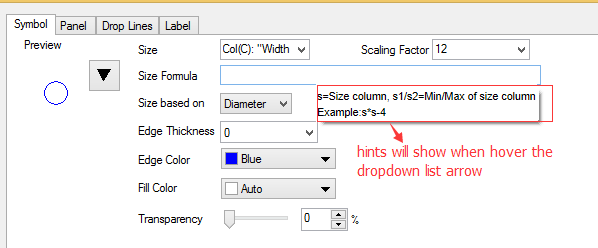
| ORG-14593 | Map symbol size to an expression of a column | Sometimes the values in Size Column are very similar and user can't see the size difference. E.g. all are big values, etc. With Size formula, user can specify some math expression based on values in Size column.
|
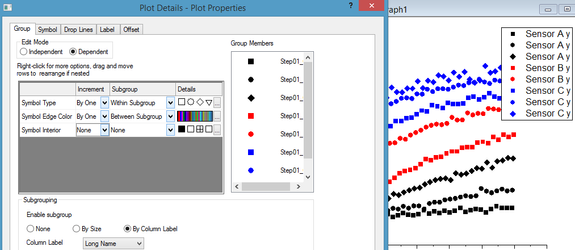
| ORG-13699 | Control how each plot attributes increment in subgroups of a group plot |
|
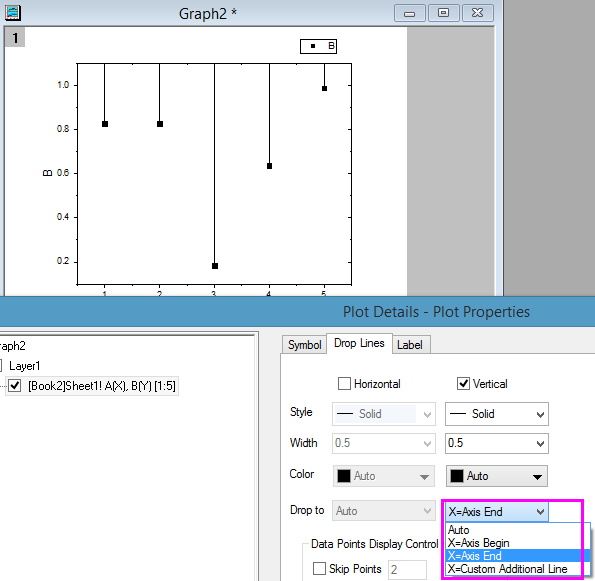
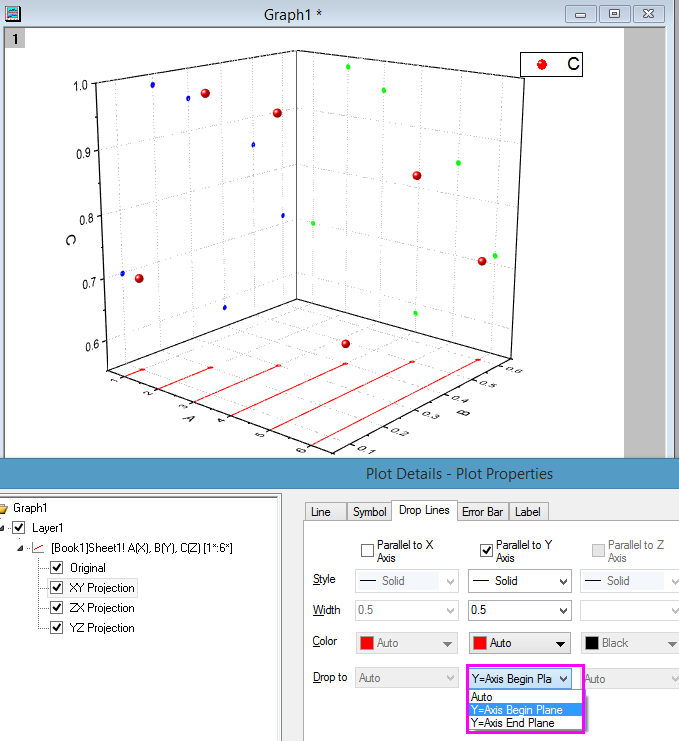
| ORG-14444 S1 | Dropline Direction Control in 2D and 3D graphs |
|
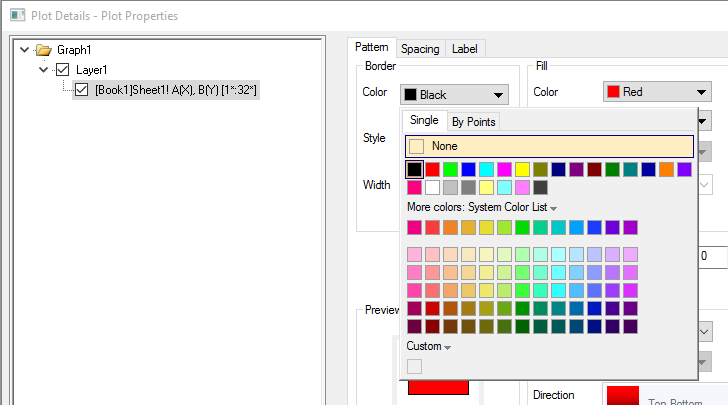
| ORG-14518 | Provide none color for border line | Add option to select none color for border line
|
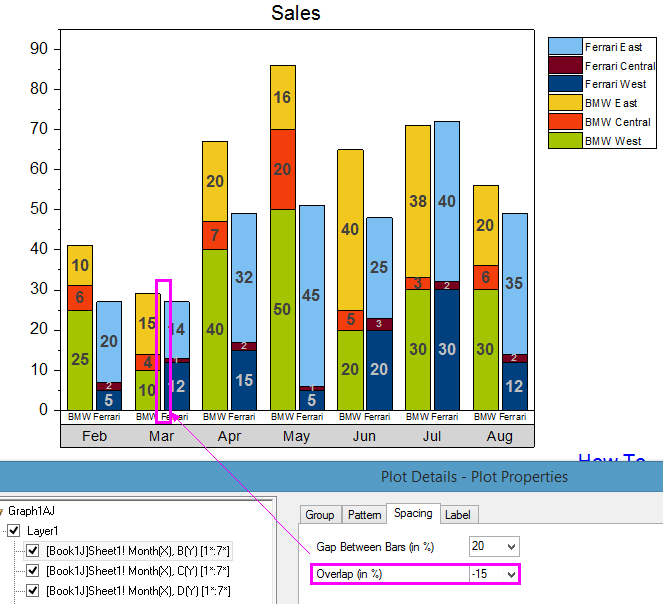
| Adjust sub-group spacing between subgroups of stacked column plot |
| |
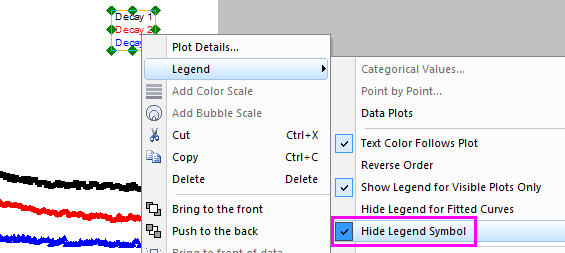
| ORG-14396 | Hide left symbol part in Legend via context menu |
|
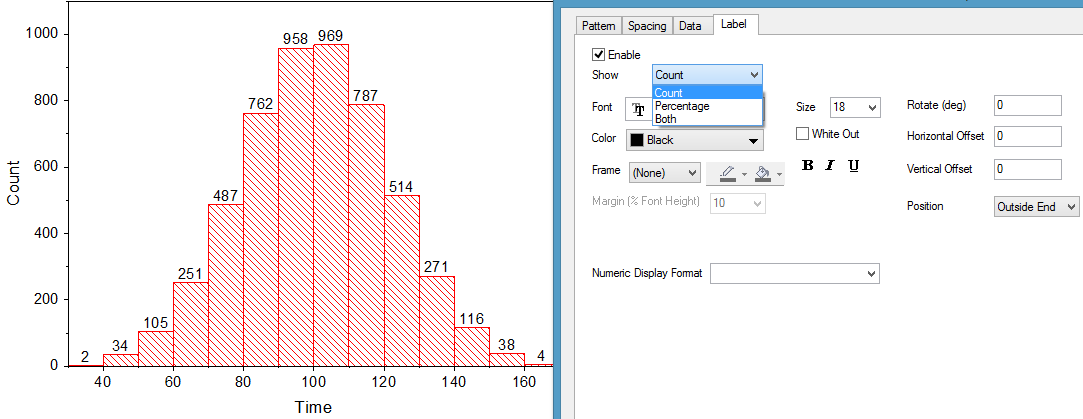
| Histogram Plot with Bin Counts or Percentage as Labels | Label tab is added in Plot Details dialog turn show Count, Percentage of both for Histogram plot.
| |
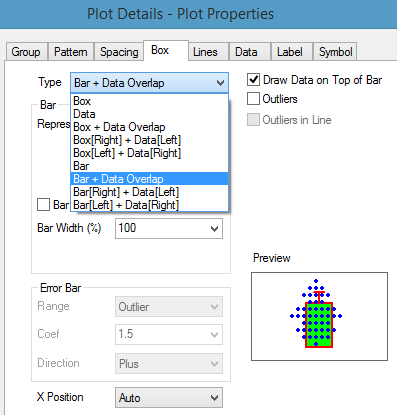
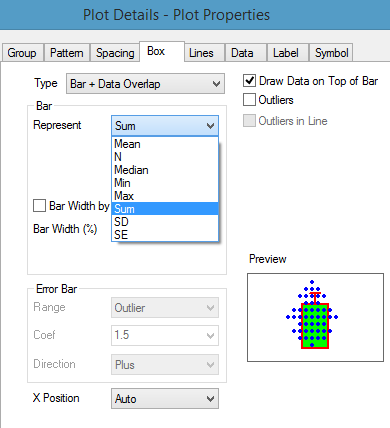
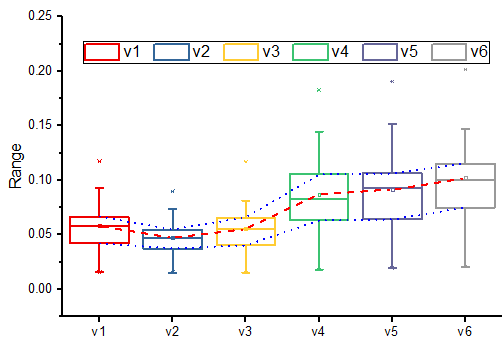
| ORG-14280 | Statistical bar support for Box Chart | Box chart can be plotted as statistical bars + data. See Box tab in Plot Details dialog.
In plot_gboxindexed dialog, add a Graph Theme: Box_Mean Bar with SE with setting as Type = Bar + Data Overlap, Bar Represent = Mean and Error Bar Range = SE. |
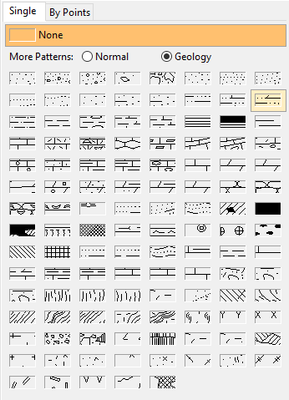
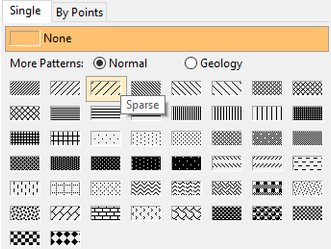
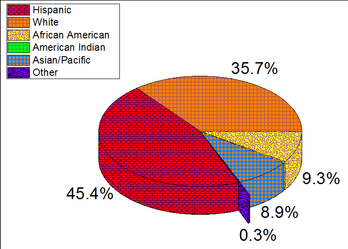
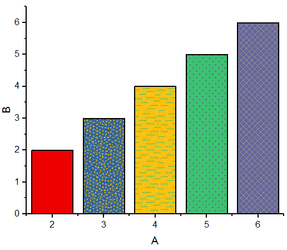
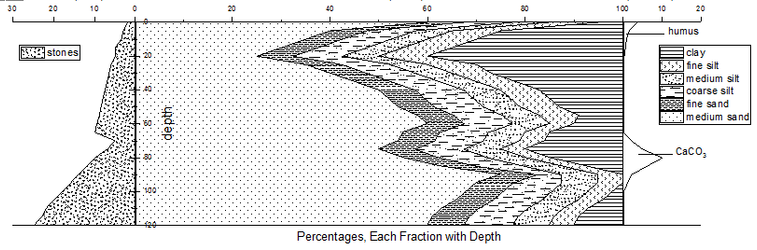
| Support hatching in contour plots for geologists, geophysicists, civil engineers and more fill patterns are added | In Plot Details dialog, Geology fill patterns are added in GUI as well as more normal patterns. Users are able to customize different hatching in contour plots, pie charts or area plots.
| |
S2, S3 | GUI for new patterns | User can ship his own patterns to specified folder of User Files Folder, then the patterns will be shown at the end of the build-in pattern list. Two system values are added to control offset factor - @PGXOF: Pattern Geology Scale X Offset Factor(Multiple factor), @PGYOF: Pattern Geology Scale Y Offset Factor(Multiple factor) |
Connect mean points, data points or other percentiles |
| |
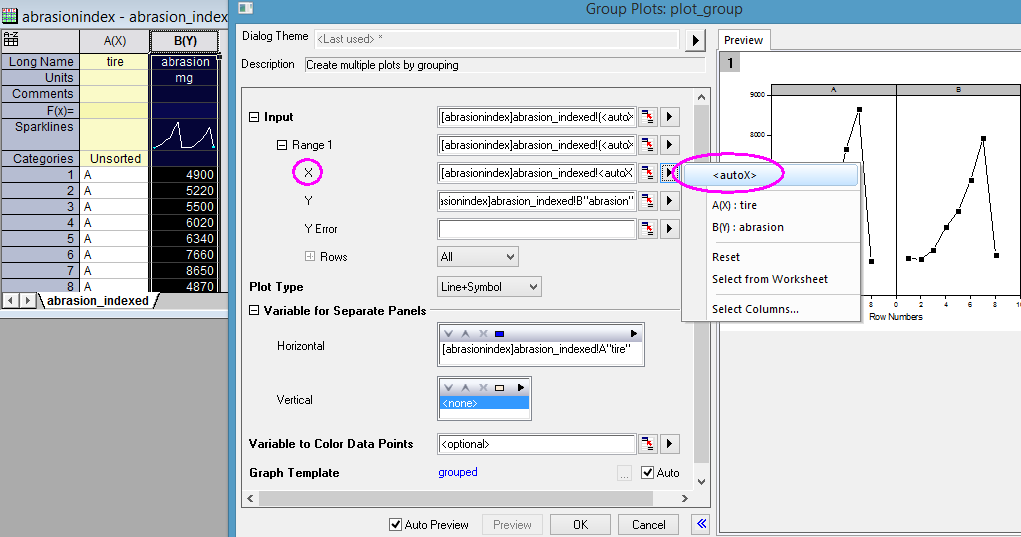
| Add AutoX as a fly-out option for Input:X in Plotting dialog | For some plot types, Origin will open a dialog first for user to specify input and settings before plot is made. E.g. Trellis Plot, Stacked Plot, Grouped Column Plot - Index Data, etc. In Input node, user can specify X to be <autoX> if user wants to plot against row indexing
| |
| ORG-13552 | Allow users to change the line color for Line Series plot | Improve Line Series plot to allow users to change the line color. |
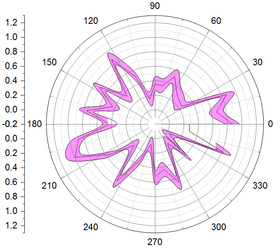
| ORG-12765 | Support Error Bars with Fill Area in Polar Chart |
|
| ORG-13835 | Support color mapping for inclusive broken option | Fill Area now works for both inclusive and exclusive broken if have modifier. |
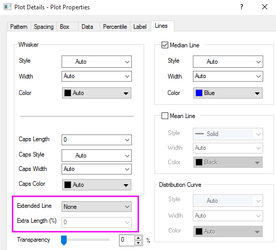
| ORG-14760 | Improvements for Box plots customization. | Improve auto coloring for lines inside box so that it will be shown as contract to the box fill color. Two new system variables are introduced: @BAC: (default 1) works just like @DLC @BACM: (default 1) to control the behavior of auto Add an option to adjust the length of box chart line.
|
Layer/Page Customization
| JIRA | SUMMARY | DETAILS |
|---|---|---|
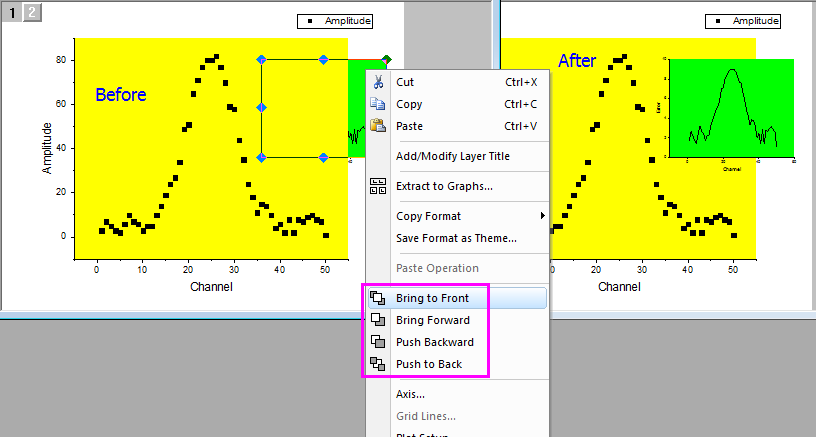
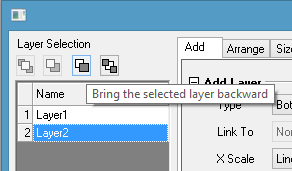
| ORG-14137 | Easier way to push change layer drawing orders.
|
|
| ORG-13470 | Exchange XY of Linked Layers together | In the past, if user has linked layers, such as Double Y, Multi-Y, multi-panel graphs, etc., when click Graph: Exchange X-Y Axes, it only changes current layer's X-Y axes. They are exchanged together now. |
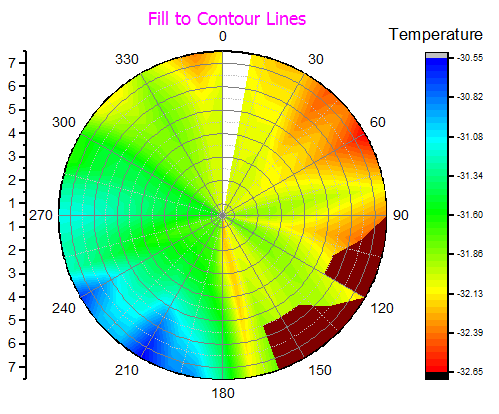
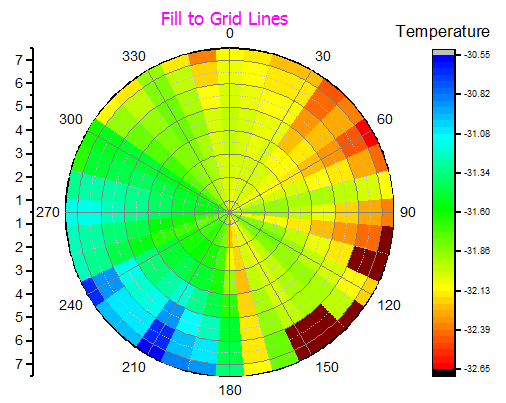
| ORG-13834 | Support Fill to Grid Lines in Polar Contour | The default color fill setting for Polar Contour by Matrix is Fill to Contour Lines. Additional option is added as Fill to Grid Lines in Colomap/Contours tab . |
Others
| JIRA | SUMMARY | DETAILS |
|---|---|---|
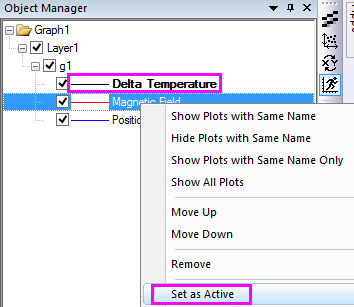
Object Manager Improvements:
|
| |
| ORG-14416 | Better options for Merge Graphs | Enable Merge Graphs toolbar button when active window is workbook since user can merge embedded graphs in workbook. When Merge Type is Specified, enable ... button for for embedded graphs. |
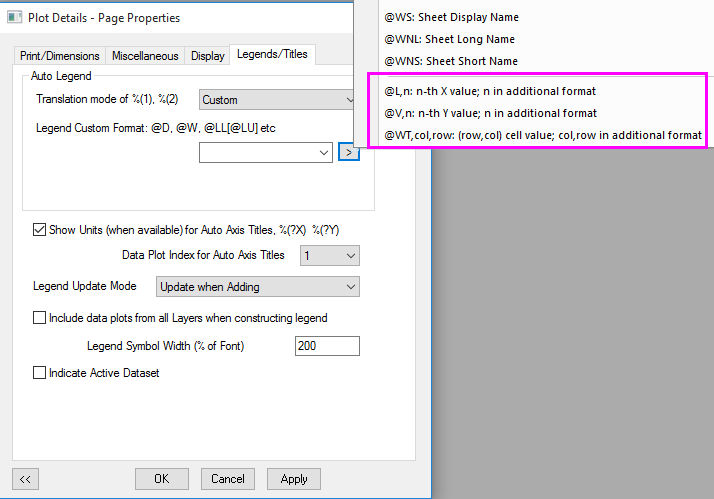
| ORG-14565 | Additional global custom legend format | For Plot Details and Updat Legend dialog, add 3 more entries as a separate group, when Translation mode of %1,%2 is set to Custom, to show the value of a praticular row or cell for each plot in the layer. @L,n: n-th X value; n in additional format @V,n: n-th Yvalue; n in additional format @WT,col,row: (row, col) cell value; col, row in additional format
|
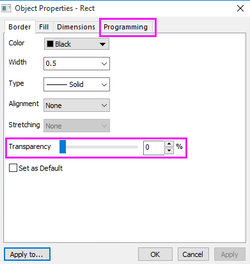
| ORG-5537 | Simple consolidated Object Properties dialog for all graph objects | Properties dialog and Programming dialog are combined to a simple consolidated Object Properties dialog. Users are able to control transparency features of graph objects in Object Properties dialog. A new system variable is added to enable/disable old Object Properties/Programming dialog: @OPD: (0/1, default is 0), 0 to disable, non-zero to enable.
|
| ORG-13876 | Improvement of copying Multiple Graph Objects | Copying multiple graph objects where layer has Fixed Factor != 1 or Scale with Layer Frame (and layer resized) may cause the objects to loose their scaling in the previous version, that is fixed in Origin 2017. |
| ORG-14835 | Add legend support for Connect Data Symbol | When user select Data in Box Chart Component and Connect Data Points, the Connect Line show with symbol in legend. |
| ORG-14397 | Update for Legend Symbol Width(%) | Setting the Legend Symbol Width to 0% in Plot Details dialog (Legend/Titles tab), whole legend symbol will not be drawn. |
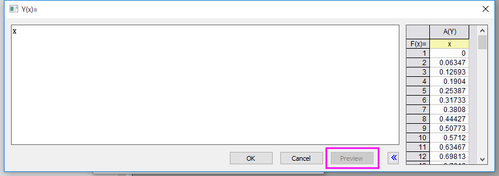
| ORG-14117 | Improve debugging of Function plots | In both Function plot dialog and Function tab of Plot Details dialog of a function plot, undefined variable will be indicated in red. In addition, underline will be added to script when it interrupts. In Y(x) dialog, add a Preview section that shows a table with two columns showing the actual XY values.
|
| ORG-14899 S2 | Batch plotting allow lower level meta element | Extend the batch plotting with option to duplicate plots from specified source. |
| ORG-15389 | Update default speed mode threshold for 2D and 3D data | Increase the default speed mode threshold for key templates. |
| ORG-16104 | Add an option to control the start of leader line of the label | For labels generated by label tab, we can change the gap between symbol and the start of leading line by "set %C -gtl 0". |