/
Fill Area Between Two Line Plots

Fill Area Between Two Line Plots

Sample OPJ download to try: Fill Area between Curves.opj 

(ORG-3693) (ORG-9716)


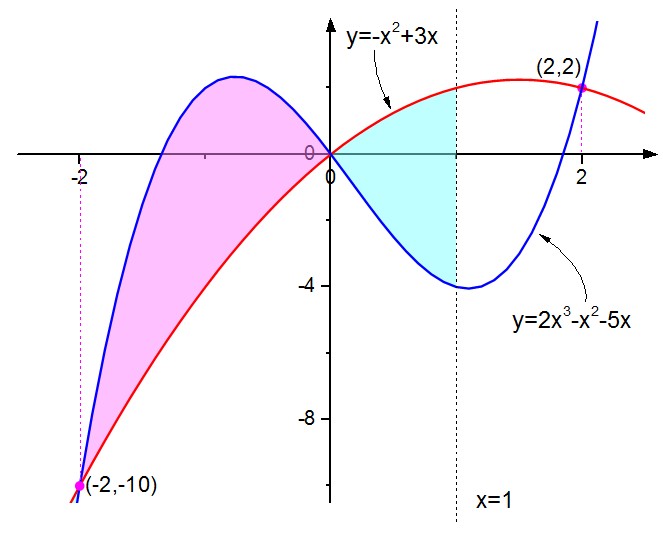
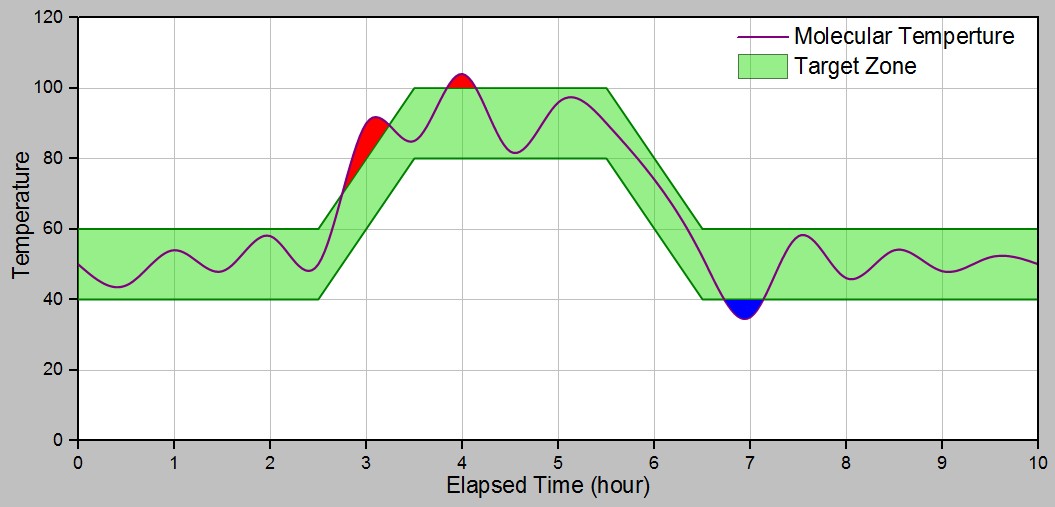
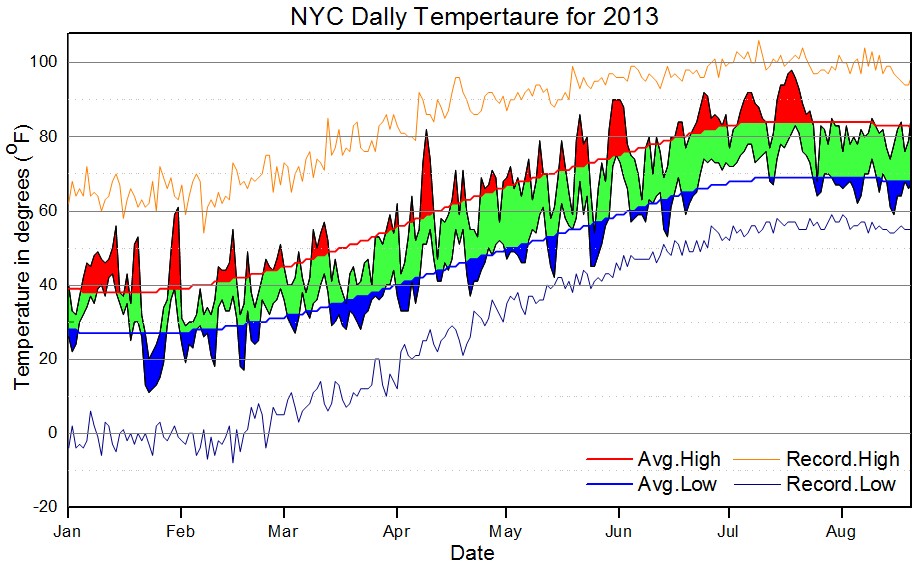
  • Filling area is between the curve and the one below it in the Layer Contents dialog, try modify the sequence of plots to get your desired graph.

How to:

  1. Go to Plot Details: Plot level: Line tab, check Fill Area Under Curve checkbox.
  2. In dragdown list, select Fill to next data plot - One Color or Fill to next data plot - Above Below Colors.
  3. In new appeared Pattern tab, set the filling details.


Related content

Show Confidence Bands and Prediction Bands like Shades Around Fitted Curve
More like this
Akima Spline Interpolation
More like this
Copy & Paste Operation
More like this
Multiple Axis Breaks and Axis Break with No Gap
More like this
LOWESS and LOESS Smoothing
More like this
Link Contour Line Color to Colormap
More like this